Stronger by Science

The online home for thinking lifters

  • Articles
  • Guides
  • Products
  • Coaching
  • MASS
    • MASS Member Login
    • Subscribe to MASS

November 22, 2016 By Greg Nuckols

The Steroid Strength Advantage: A Theoretical Approach

This article models the relative strength advantage you’d expect from steroid usage. Does theory match experimental and observational evidence?

Spread the love

  • Facebook
  • Twitter
  • LinkedIn
  • Reddit
  • Tumblr
  • Email
  • Pocket
  • More
  • Print
  • Pinterest

Over the past year, I wrote a series of loosely related articles discussing the relationship of strength and muscle mass.

I’m realizing now that I wrote them completely out of order.  This is the order they should have come out in, to introduce the concepts in a logical sequence.

  1. Who’s the Most Impressive Powerlifter to introduce the concept of allometric scaling and the difference between absolute strength and relative strength
  2. Strength vs. Size: How Important is Muscle Growth for Strength Gains to discuss the relationship between strength and muscle size in more depth,
  3. The Drug-Free Muscle and Strength Potential articles (one, two) to introduce the equations (based on muscle mass relative to height) that can be used to predict, quite accurately, strength potential for people who focus on powerlifting and are relatively gifted for the sport.
  4. How Much More Muscle Can You Build With Steroids to rigorously assess the advantage steroids give you for building muscle.
  5. This current article, to show the relative strength advantage you should expect to get from steroids.
  6. Steroids for Strength Sports:  The Disappointing Truth to assess whether the predictions in this article, based on the equations presented and developed earlier in the series, actually play out in the real world.

However, I wrote them in almost the exact opposite order, so the first installment, which looked at the relative strength advantage provided by steroids, caused a bit of an uproar.  This was partially my fault since I hadn’t provided enough context.  To many people, the estimate that steroids provided a relative strength advantage of roughly 10% seemed like it simply had to be too low (though it was based on the best available data).

Couched in the context of the rest of this series, however, it’s easy enough to demonstrate mathematically that the advantage you’d expect, based on the current research, is somewhere in the neighborhood of 10%.  That’s what I aim to do in this article to tie this series together and put a nice little bow on it.

If you’ve already read this series and you more-or-less understand all of the info and equations, you can just play around with the spreadsheet I made that does all the calculations for you.  Otherwise, keep reading for a quick recap of this series and an explainer of the equations used to arrive at the prediction.


Absolute vs. Relative Strength

This is a key distinction and one that often gets lost in these discussions:

Absolute strength is simply the amount of weight you can lift.  Relative strength is the amount of weight you can lift, relative to how large you are.

For example, if your squat goes from 500 to 550lbs, your absolute strength has increased without doubt.  If it goes from 500 to 550lbs without a change in bodyweight, your relative strength has also increased.  However, if your squat goes from 500 to 550lbs while your weight goes from 200 to 250lbs, your relative strength has decreased.

Relative strength is a thorny subject, because there’s no single agreed-upon way to assess it.

Strength to bodyweight ratios (i.e. squatting 2x bodyweight) are popular because they’re simple, but they’re not a great way to judge relative strength because they almost always favor lighter lifters.  There are a lot more 150lb lifters who deadlift 450lbs than there are 250lb lifters who deadlift 750lbs.

Most powerlifting organizations use formulas like the Wilks formula or Glossbrenner formula to normalize relative strength performances and select the “best lifter” in a powerlifting meet.  The Sinclair formula in weightlifting serves the same purpose.  These formulas certainly do a better job than strength to bodyweight ratios, but I have some methodological quibbles with them.  They’re not worth rehashing here, but you can read more about them in this article.

The scaling method I prefer for assessing relative strength is 2/3 power allometric scaling.  This method of allometric scaling is based on the assumption that body mass scales linearly with body volume which is a third-order characteristic (which is a mathematically true relationship, assuming density – body composition in this case – remains constant), and strength scales linearly with muscle cross-sectional area which is a second-order characteristic (which may not always be true for people in the general population, but which seems to be true in the highly trained lifters for whom normalizing relative strength is important).

Regardless of the method you use to assess relative strength, the distinction between absolute and relative strength is an important one.  Steroids certainly help you get stronger, but they primarily help you get stronger by helping you build more muscle.  That muscle isn’t weightless, however, so the boost they provide for relative strength will be smaller than the boost they provide for absolute strength.

Predicting Strength Based on Jacked-ness

As discussed in these two articles (one, two), there is a very strong relationship between strength and fat-free mass per unit of height in elite powerlifters.  Variation in FFM/cm can explain roughly 75% of the variability in bench and deadlift strength and almost 90% of the variability in squat strength.

Based on these relationships, we can use a simple regression equation to predict someone’s maximal strength capabilities based on how jacked they are:  Powerlifting total (in kg) = 1563.9(FFM/cm)+77.32

So, for example, if someone’s 180cm tall and has 80kg of lean body mass, you’d expect them to total around 772kg (1700lbs) if they were a very skilled powerlifter.

Now, this formula doesn’t hit the nail on the head every time.  Some people exceed the predictions if they’re exceptionally skilled lifters and very gifted for strength, and many people fall short of the predictions if they don’t train in a way that’s optimized for strength development or if they’re less gifted for strength development (and since the equation is based on high-level powerlifters, it is probably a bit too optimistic for a lot of people).  However, it certainly does a good enough job to put us in the right ballpark for predicting maximal strength capabilities for a larger group of people when we’re dealing with averages.

How Much More Jacked Can You Get With Steroids?

For the long answer to this question, you can check out this article.  But here’s the short version:

Fat-free mass index (a formula to normalize the amount of lean body mass you have relative to your height) is often used to assess human muscularity.  The higher your FFMI, the more jacked you are.

The average untrained male has an FFMI around 18.9.  With training, it seems the typical drug-free male ends up with an FFMI around 22.3, with a standard deviation of 1.9 FFMI points.  On the other hand, the typical steroid user ends up with an FFMI around 25.5, with a standard deviation of 2.6 FFMI points, based on data from Kouri and Brennan.

In other words, the average steroid user gains roughly twice as much lean body mass over the course of a training career:  6.6 vs. 3.4 FFMI points.  For an average-height male, that means the typical steroid user ends up with 10.4kg (23lbs) more lean body mass than a non-user.

Furthermore, the typical range of FFMIs for steroid users is larger than the typical FFMI range for non-users:  5.2FFMI points vs. 3.8 FFMI points (±1 standard deviation), meaning that as you get further from “average,” the gap between users and non-users grows.  When you’re dealing with averages, the typical steroid user may be 3.2 FFMI points bigger and have 10.4kg more lean body mass, but by the time you get 3 standard deviations above the mean (i.e. where elite athletes would end up), steroid users have a 5.3 FFMI point advantage, corresponding with about 17kg (38lbs) more lean body mass for an average-height male.

In short, this should not come as a surprise to anyone, but steroids work really, really well for helping you build more muscle.

The Effects of Steroids on Relative Strength

Now that the stage has been set, we can predict the relative advantage afforded by steroids with some simple arithmetic using the data and formulae above.  Click on the footnote to check my work. I’m just including all of the algebra so you can see I’m not using any mathematical sleights of hand.  I’ll illustrate using allometric scaling to calculate relative strength.

1

Assuming you don’t want to do all the math by hand, you can play around with this spreadsheet instead.

Let me walk you through it.

Page 1:  Initial Assumptions

screenshot-2016-11-20-20-26-30

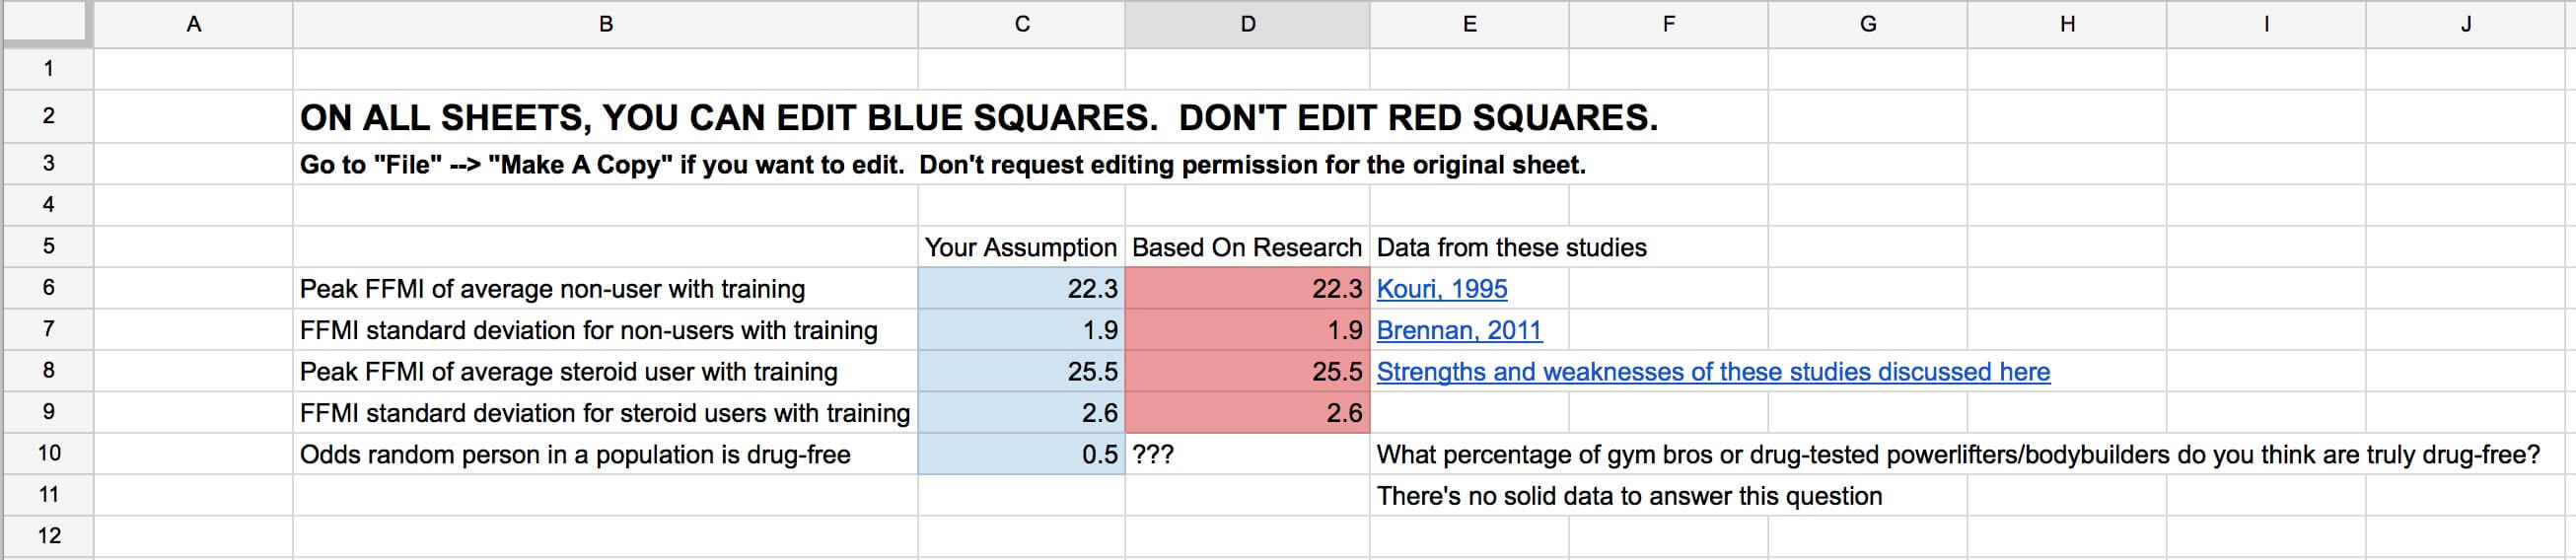
The numbers you enter on this page will substantially influence every other calculation.

The data entered in cells C6 through C10 are editable.  The first four come filled-in based on the FFMI data provided by Kouri and Brennan, but you can play around with different assumptions to see how they affect the calculations.  Cell C10 (odds a random person in a population is drug-free) is entirely up to you, and it affects the odds of someone’s natty-ness with a given FFMI on the third page.

Page 2:  Steroid Strength Advantage

screenshot-2016-11-20-20-30-36

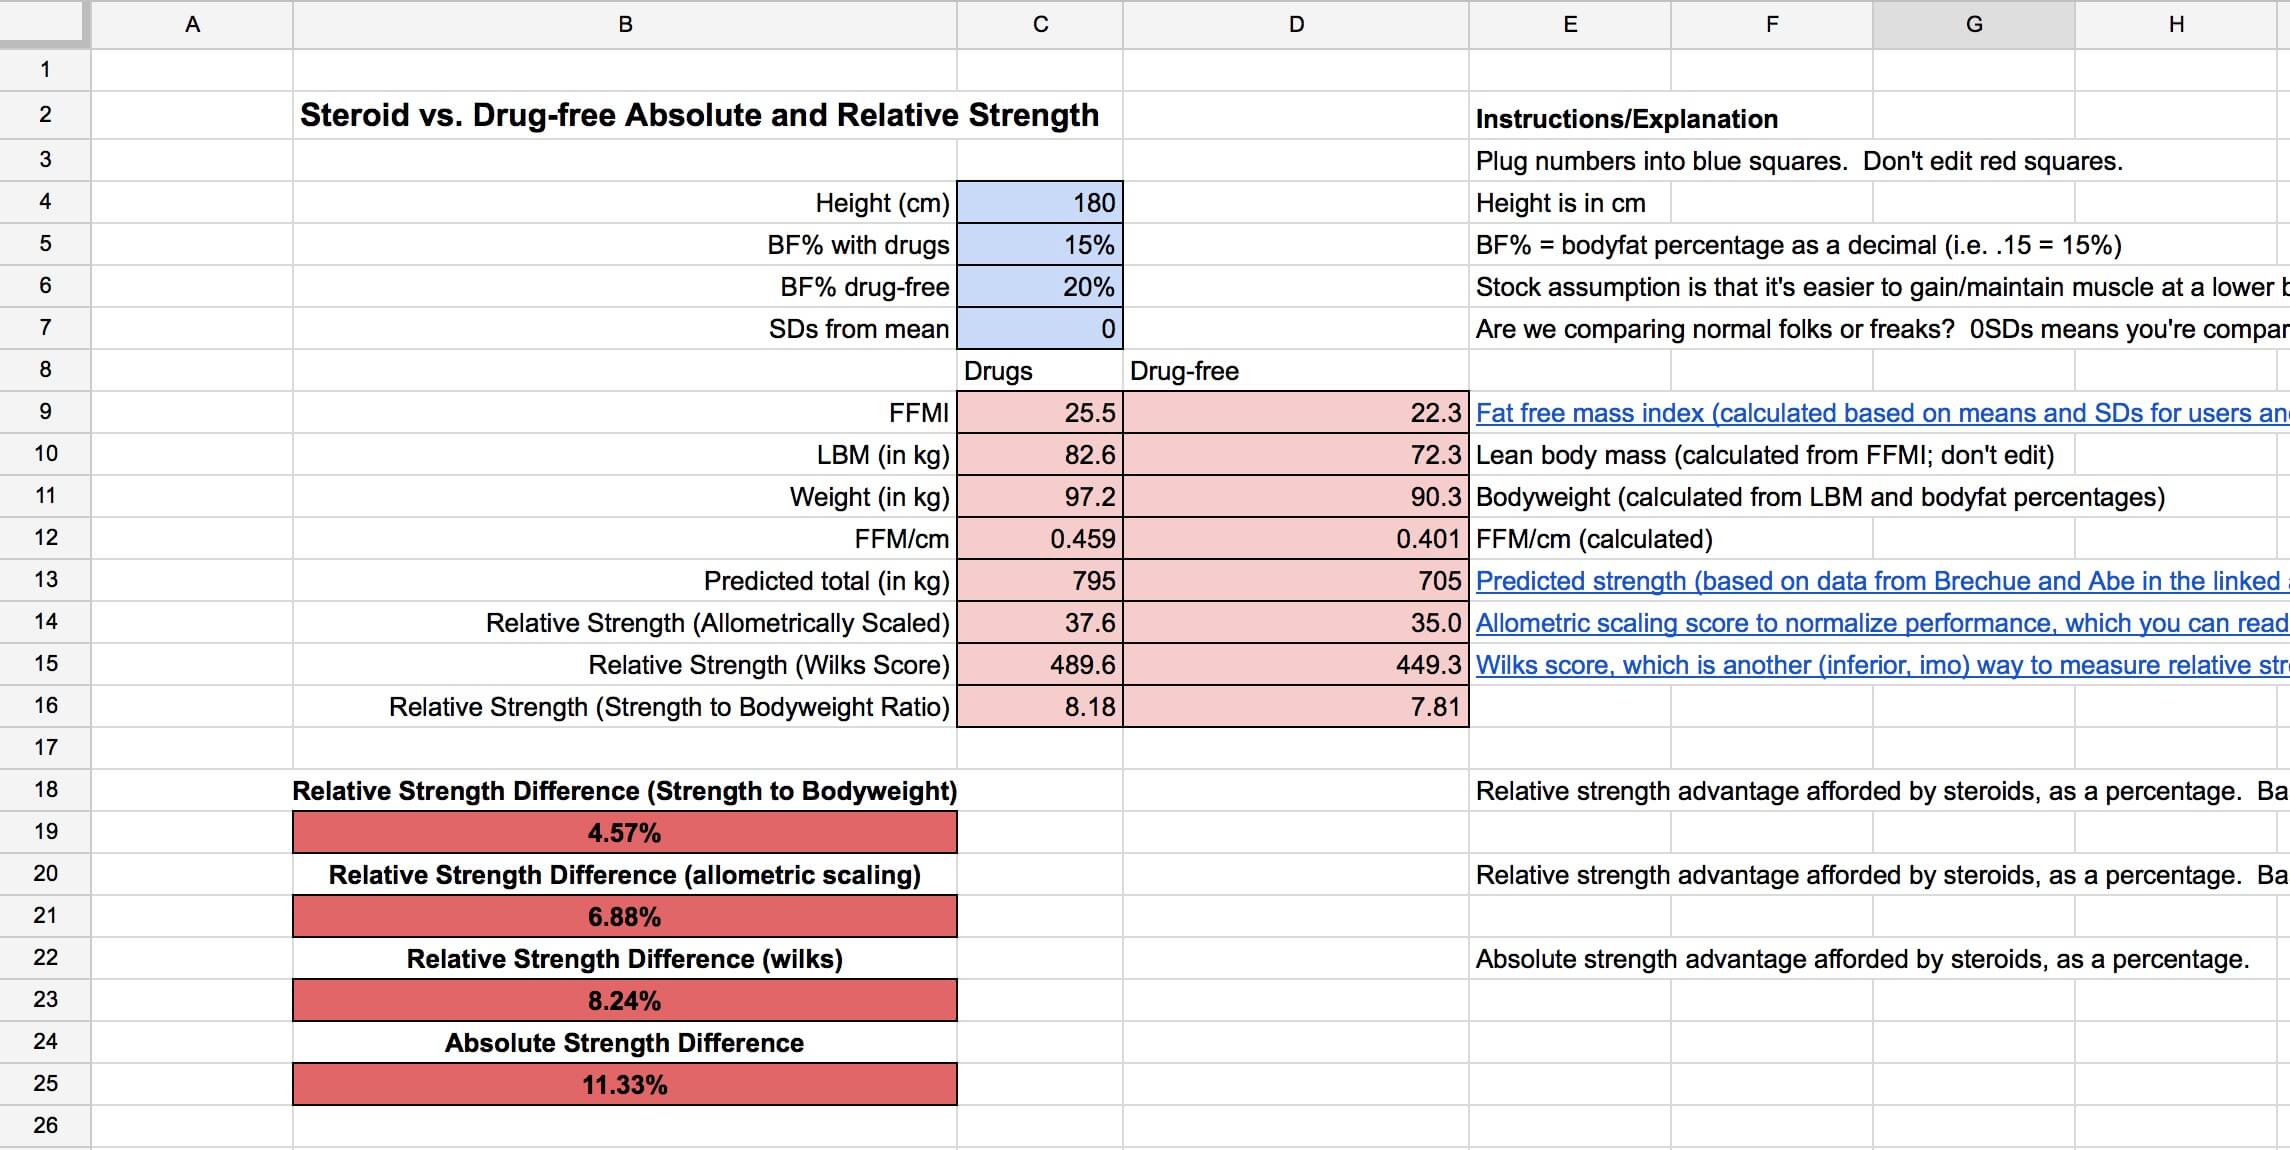
This page does all of the really ugly algebraic calculations for you and shows you the differences in users and non-users every step of the way.

All you need to do is fill in cells C4 through C7, and it’ll do the rest.

This is fun to play with, I think.  It seems taller people are afforded a larger advantage than shorter people.  The assumptions you make about the differences in body fat percentage has a pretty large impact.  If you assume steroids let people stay 10% leaner, the relative strength advantage is roughly 60% larger than if you assume steroids let people stay 5% leaner, for example.  Finally, you can see how the advantage afforded by steroids gets progressively larger the further you get from the mean.  The relative strength advantage is roughly 50% larger at 3-4 SDs from the mean versus 0 standard deviations from the mean.

Also note that the relative strength advantage is always smaller than the absolute strength advantage.  This page also lets you see who’s advantaged and disadvantaged by each relative strength formula at various body weights.  More muscle provides a larger allometric scaling benefit than Wilks benefit for lighter lifters, but the trend is reversed for taller/heavier lifters.

Page 3:  Odds Someone Is Drug-Free

screenshot-2016-11-20-20-49-12

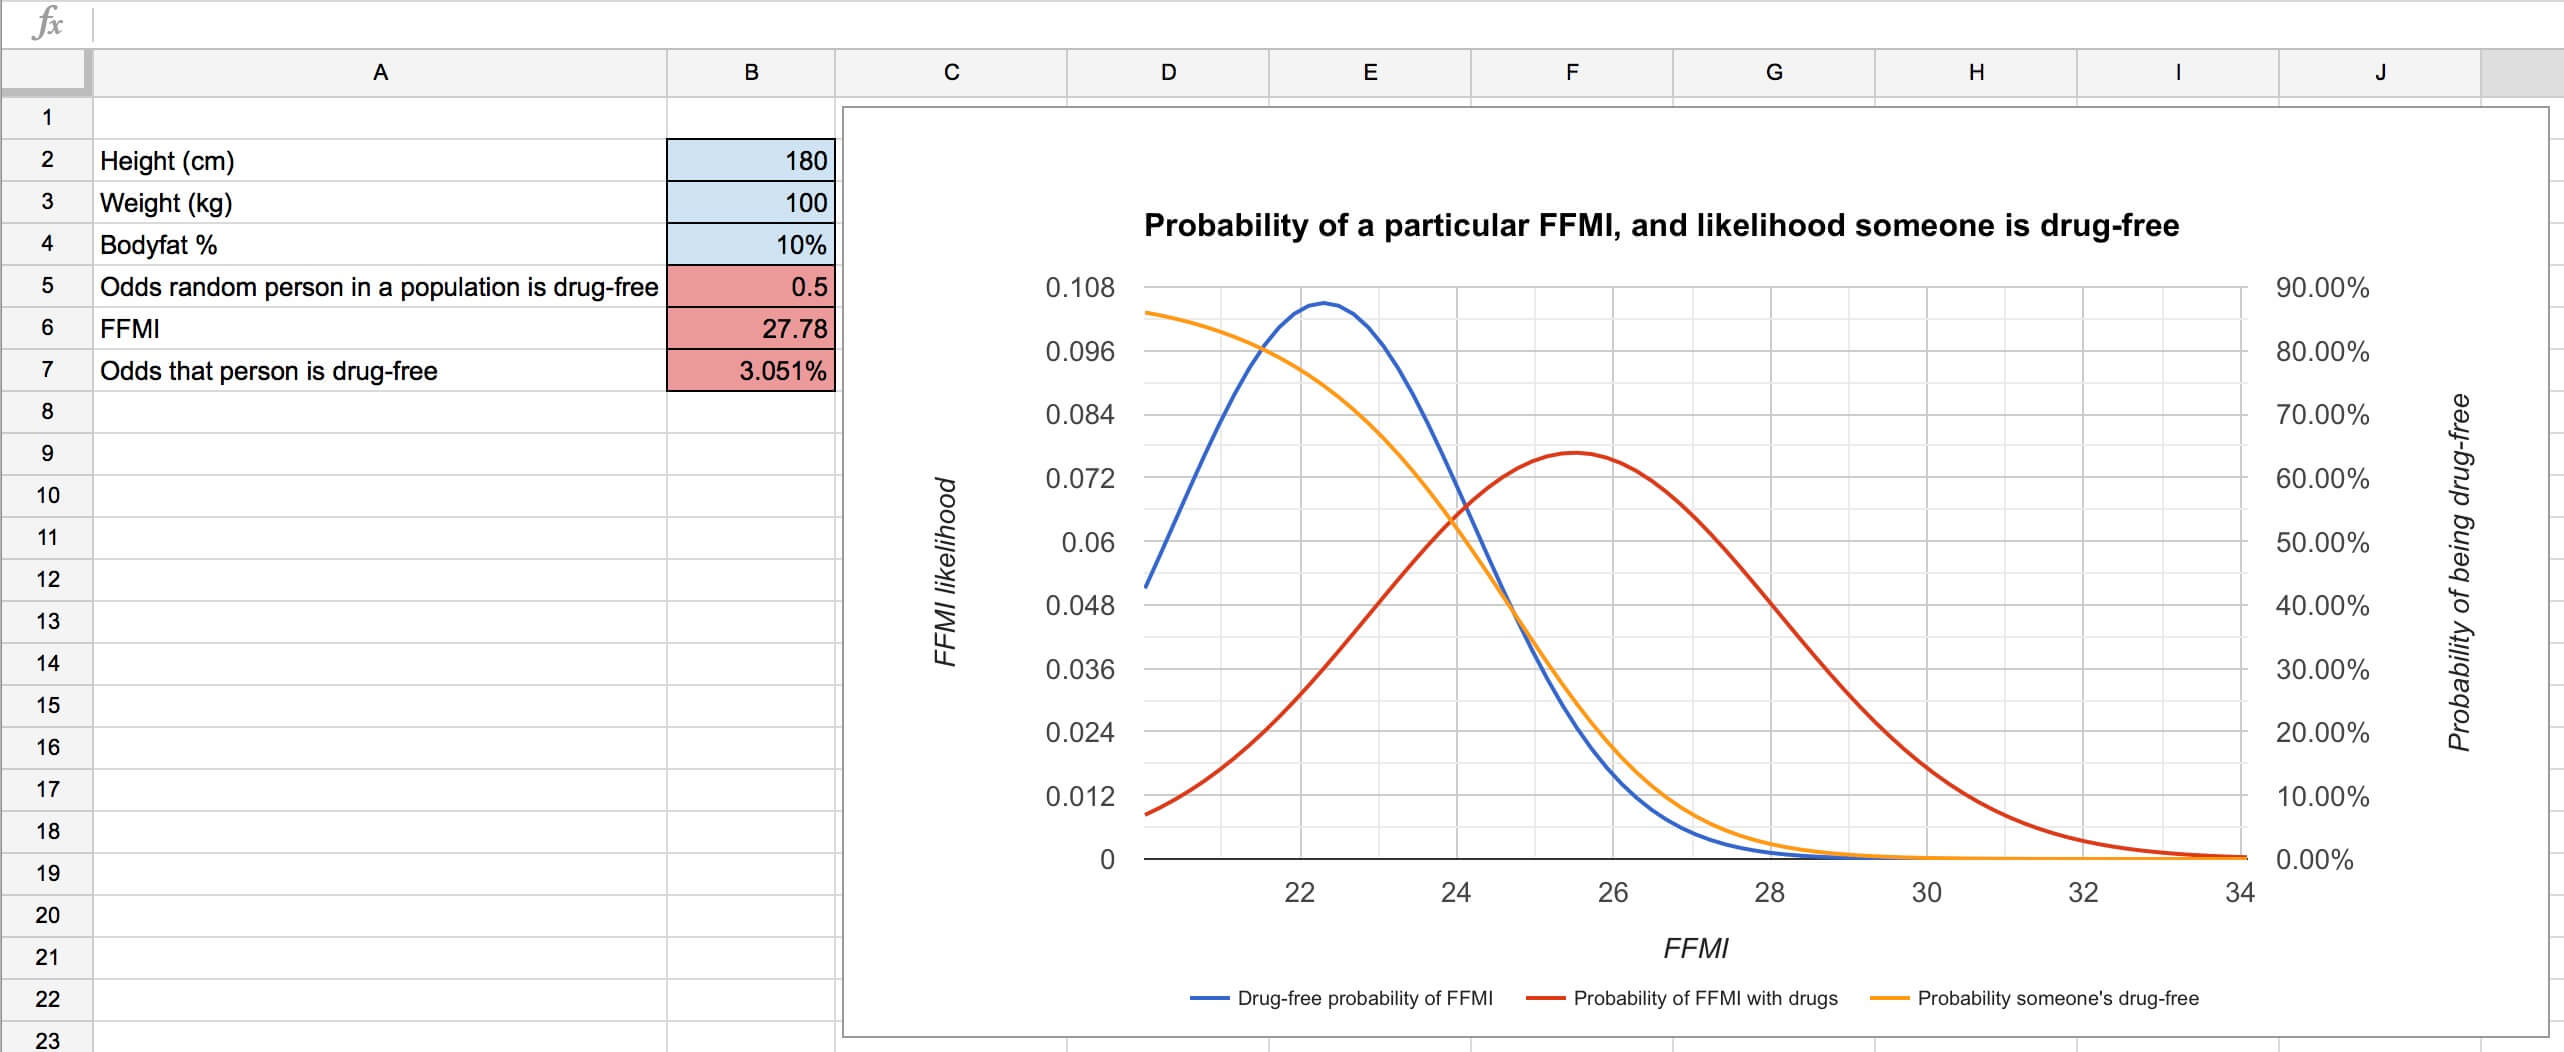
This page is an upgraded version of the tables near the end of this article.

It’s pretty simple.  You fill in the blue squares, and the sheet calculates the FFMI based on the data you input.  Then, based on some more simple math (probability density functions for FFMIs of users and non-users, based on the means and standard deviations of each population, weighted by your assumptions about the proportion of a population you think is actually drug-free), it tells you the probability that someone with such an FFMI is drug-free.

The blue curve is the odds of attaining a specific FFMI for a drug-free person, and the red curve is the odds of attaining a specific FFMI for someone on steroids.  Both are weighted based on the percentage of the specific population you think is drug-free.  For example, if you think 80% of the people in a given population are drug-free, it’ll make the blue curve bigger and the red curve smaller.  The peak of the red curve is further to the right, denoting a higher average degree of muscularity for steroid-users, and there’s also more spread, denoting the larger standard deviation (potentially arising from differences in the compounds and dosages people use) for steroid-users’ FFMIs.

The yellow curve is the probability that someone with a given FFMI is drug-free (the likelihood is on the right y-axis).  You see that where the blue curve is higher than the red curve, the probability is higher (indicating more drug-free people with a given FFMI), and where the red curve is higher than the blue curve, the probability is lower (indicating more steroid-users with a given FFMI).  At the FFMI where the two curves intersect, the probability of someone being drug-free is 50/50.

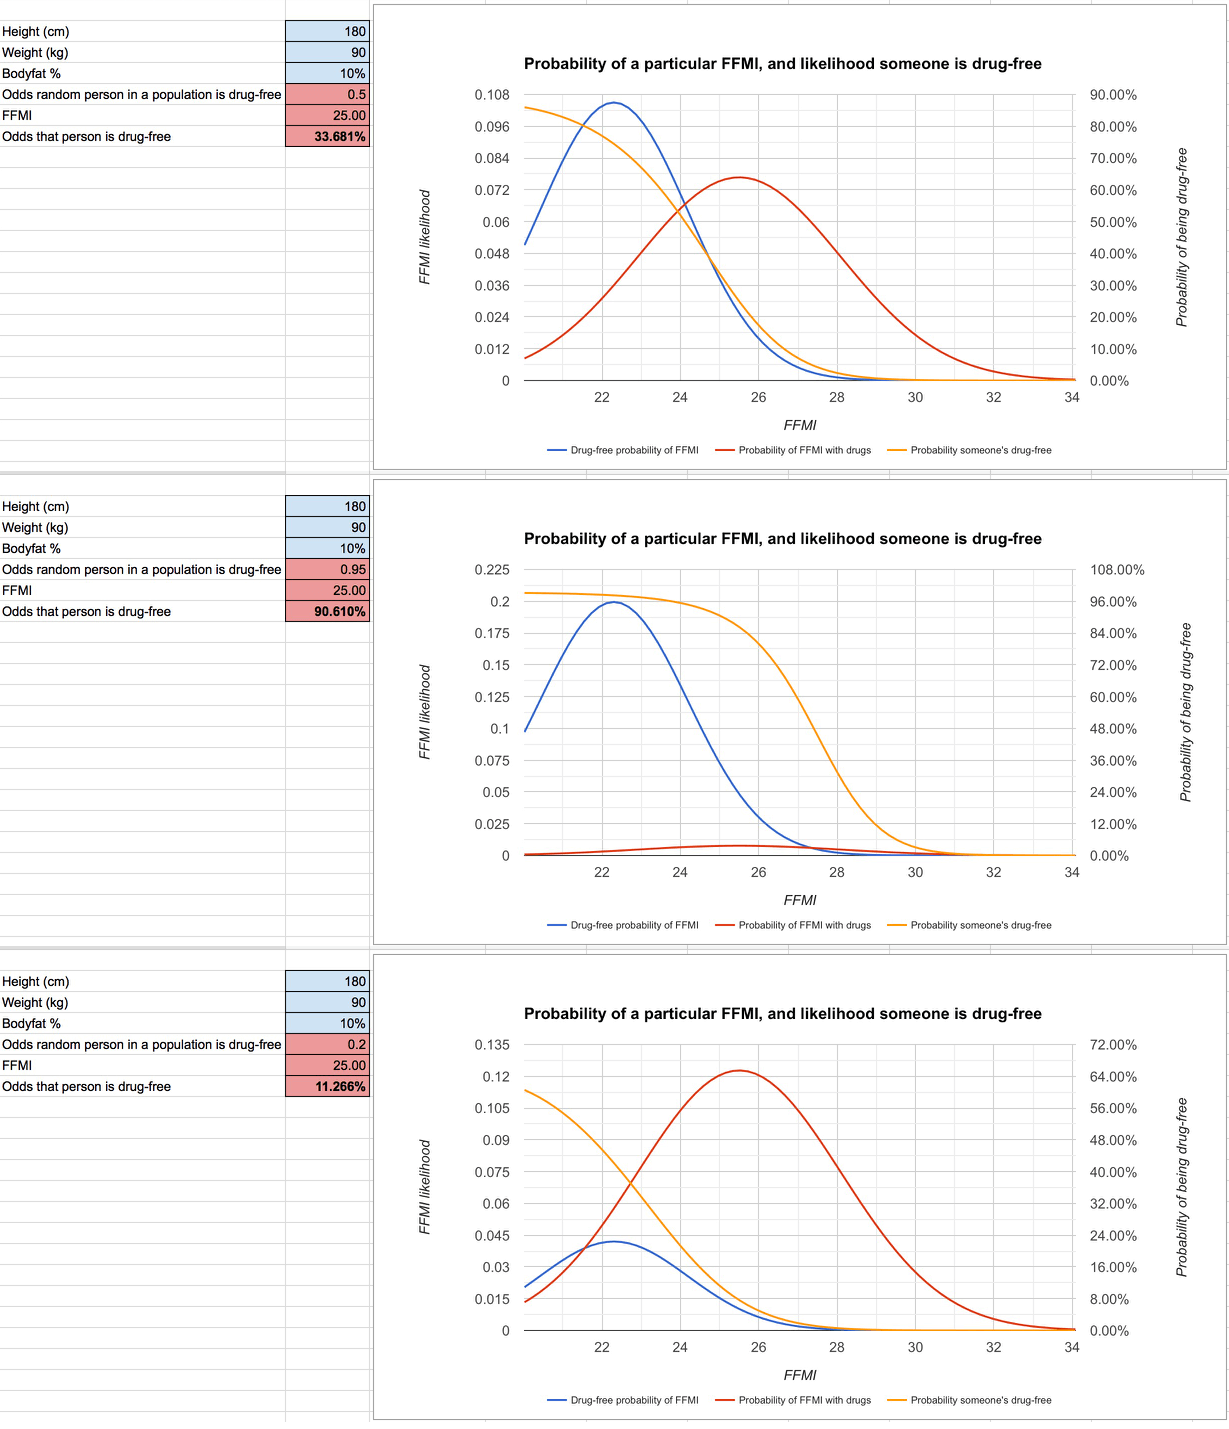
The assumptions you start with on the first tab will affect this graph substantially – if you change the mean FFMIs for each group, that will shift the red and blue curves left or right.  If you change the FFMI standard deviations, that will affect how spread-out the red and blue curves are.  If you change the proportion of a population you think is drug-free, that’ll impact the overall size of each curve.  All of these changes will affect the probability that someone with a given FFMI is drug-free (the yellow curve).


Perception = Reality.  The Power of Confirmation Bias

This is where the rubber meets the road for this whole series.

Depending on the assumptions you start with, you can get any outcome you want from this spreadsheet.  The first page (initial assumptions) determines how the rest of this sheet will behave.

If you go with the FFMI data from Brennan and Kouri (FFMIs of 22.3 ± 1.9 for non-users, and 25.5 ± 2.6 for users) and assume a steroid user can stay about 5% leaner than a non-user, you’d expect steroids to provide a relative strength advantage of roughly 7% for an average person, and around 11% for people 4SDs from the mean (averaging allometric scaling and Wilks).

If you start with the assumption that an FFMI of 25 is a hard limit for non-users (a common myth), then you’d expect a relative strength advantage of 16-17% 4 SDs from the mean.  If you combine that assumption with the assumption that users can stay 10% leaner instead of 5%, and the relative strength advantage jumps to almost 20%.

Similarly, if you start with the assumption that 50% of drug-tested powerlifters or bodybuilders are lying about drug use, then based on Brennan and Kouri’s FFMI data, someone who’s 180cm tall, 90kg, and 10% bodyfat with an FFMI of exactly 25 would have a 33.7% chance of being drug-free.  If you assume 95% of drug-tested athletes are actually drug-free, then this person would have a 90% chance of being drug-free.  If you assume 80% of them are lying, however, his odds of being drug-free would be only 11%.

ffmi-assumptions
Top image: Same total number of users are non-users. Middle image: 19x more non-users than users. Bottom image: 4x more users than non-users. Notice how much earlier the yellow probability line drops in the bottom image vs. the middle image.

I think this is the fundamental reason why this is such a contentious subject.  People come to this discussion with different sets of assumptions, and those assumptions alter their expectations.  Those expectations affect how they interpret what they see (and even what data they’ll accept and what data they’ll reject), which further ingrains their biases.  People who start with charitable assumptions about what drug-free athletes can accomplish and charitable assumptions about the proportion of drug-tested athletes who are actually drug-free are automatically labeled as naïve. Conversely, people who start with low assumptions about what drug-free athletes can accomplish and who assume most tested athletes are just cheaters who are beating the tests are automatically labeled as overly cynical.

This spreadsheet should show you how both “sides” can feel comfortable with their conclusions, based on differences in starting assumptions.


Bringing this series full-circle, the roughly 10% relative strength advantage from steroids proposed in this article seems to be a figure with experimental, observational, and (now) theoretical support.  If you use Kouri and Brennan’s FFMI data, for most reasonable heights, body composition differences (0-10%), and distances from the mean (i.e. unless you project things out to 6+ standard deviations from the mean), the predicted relative strength advantage afforded by steroids tends to hover between 6-13% for both Wilks and Allometric Scaling.

If you disagree with the figure, there are a few ways you could dispute it:

  1. Provide better data showing average FFMIs for users and non-users.
  2. Show that the relationship between FFM/cm and strength is substantially different from the one found in Brechue and Abe’s work.  Crucially, the strength increase for each increase in FFM would need to be larger than the one they found (a smaller increase per kg of FFM would decrease the predicted relative advantage of gaining FFM via steroids).
  3. Provide solid data showing that steroids increase strength independent of gains in muscle mass in elite athletes (i.e. that they raise the limit of attainable normalized muscle force, and don’t just potentially increase the rate of increase in untrained people).  This is an idea I’ve seen floated before, but haven’t come across any solid data to support it.

Otherwise, I think it’s time to put a bow on this series for now.

Featured Image Credit:  hookgrip


  1. Basic formula:

    (Allometric scaling score drug-free – allometric scaling score with steroids)/(allometric scaling score with steroids)

    Expand the allometric scaling formula; Allometric scaling score = weight lifting × (body mass)-2/3

    (Drug-free powerlifting total × (drug-free body mass)-2/3 – Powerlifting total with steroids × (body mass with steroids)-2/3)/(Powerlifting total with steroids × (body mass with steroids)-2/3)

    Expand the formula used to predict strength; Powerlifting total (in kg) = 1563.9(FFM/cm)+77.32

    ((1563.9 × (Drug-free FFM/cm) + 77.32) × (drug-free body mass)-2/3 – (1563.9 × (FFM with drugs/cm) + 77.32) × (body mass with steroids)-2/3)/((1563.9 × (FFM with drugs/cm) + 77.32) × (body mass with steroids)-2/3)

    Expand the body mass formulae; Normalized FFMI = FFM/(height in m)2 + 6.1 × (1.8 – height in m), so FFM = (FFMI – 6.1 × (1.8 – height in m)) × (height in m)2.  Body mass = Lean body mass/(1 – body fat percentage)

    ((1563.9 × (((Drug-free FFMI – 6.1 × (1.8 – (cm/100)))*(cm/100)2)/cm) + 77.32) × (((Drug-free FFMI – 6.1 × (1.8 – (cm/100)))*(cm/100)2)/(1 – drug-free bodyfat percentage))-2/3 – (1563.9 × (((FFMI with steroids – 6.1 × (1.8 – (cm/100)))*(cm/100)2)/cm) + 77.32) × (((FFMI with steroids – 6.1 × (1.8 – (cm/100)))*(cm/100)2)/(1 – bodyfat percentage with steroids))-2/3)/((1563.9 × (((FFMI with steroids – 6.1 × (1.8 – (cm/100)))*(cm/100)2)/cm) + 77.32) × (((FFMI with steroids – 6.1 × (1.8 – (cm/100)))*(cm/100)2)/(1 – bodyfat percentage with steroids))-2/3))

    Now allow for FFMI variability to account for standard deviations; FFMI = Mean FFMI ± (number of standard deviations × size of standard deviation)

    ((1563.9 × ((((mean drug-free FFMI ± (drug-free FFMI standard deviation × standard deviations from the mean)) – 6.1 × (1.8 – (cm/100)))*(cm/100)2)/cm) + 77.32) × (((((mean drug-free FFMI ± (drug-free FFMI standard deviation × standard deviations from the mean)) – 6.1 × (1.8 – (cm/100)))*(cm/100)2)/(1 – drug-free bodyfat percentage))-2/3 – (1563.9 × (((((mean FFMI with steroids ± (FFMI standard deviation with steroids × standard deviations from the mean)) – 6.1 × (1.8 – (cm/100)))*(cm/100)2)/cm) + 77.32) × (((((mean FFMI with steroids ± (FFMI standard deviation with steroids × standard deviations from the mean)) – 6.1 × (1.8 – (cm/100)))*(cm/100)2)/(1 – bodyfat percentage with steroids))-2/3)/((1563.9 × (((((mean FFMI with steroids ± (FFMI standard deviation with steroids × standard deviations from the mean)) – 6.1 × (1.8 – (cm/100)))*(cm/100)2)/cm) + 77.32) × (((((mean FFMI with steroids ± (FFMI standard deviation with steroids × standard deviations from the mean)) – 6.1 × (1.8 – (cm/100)))*(cm/100)2)/(1 – bodyfat percentage with steroids))-2/3))

    The number it spits out will be negative, denoting the relative disadvantage of a drug-free athlete.

    P.S. I’m almost certain there are too many parentheses above.

    We can plug in height in cm, means and standard deviations for FFMI with and without steroids (based on Kouri and Brennan’s data, or your own assumptions), how many standard deviations from the mean you’re interested in (i.e. are you interested in the average advantage of steroids, or the advantage they give elite competitors), and the bodyfat percentages where you think someone would perform best on steroids and drug-free (since most people assume that steroids allow you to get leaner before performance is compromised), and this formula will predict the relative advantage steroids will give.

    ↩

Spread the love

  • Facebook
  • Twitter
  • LinkedIn
  • Reddit
  • Tumblr
  • Email
  • Pocket
  • More
  • Print
  • Pinterest

Related

Filed Under: Articles, Genetics and Strength Potential, Steroids Tagged With: ffmi, hypertrophy, steroids, strength

About Greg Nuckols

Greg Nuckols has over a decade of experience under the bar, and a BS in Exercise and Sports Science. He’s held 3 all-time world records in powerlifting in the 220 and 242 classes.
 
He’s trained hundreds of athletes and regular folks, both online and in-person. He’s written for many of the major magazines and websites in the fitness industry, including Men’s Health, Men’s Fitness, Muscle & Fitness, Bodybuilding.com, T-Nation, and Schwarzenegger.com. Furthermore, he’s had the opportunity to work with and learn from numerous record holders, champion athletes, and collegiate and professional strength and conditioning coaches through his previous job as Chief Content Director for Juggernaut Training Systems and current full-time work here on Stronger By Science.
 
His passions are making complex information easily understandable for athletes, coaches, and fitness enthusiasts, helping people reach their strength and fitness goals, and drinking great beer.
 
Facebook, Twitter, YouTube

Comments

  1. Tulu says

    November 24, 2016 at 10:07 am

    If the average drug-free lifter has a FFMI of 22.3, then shouldn’t that be the point at which the odds of someone being drug-free is 50%? In which case you’d want to set the “odds of a random person being drug free” to 0.26. Is this not the most reasonable assumption?

    Reply
    • Greg Nuckols says

      November 25, 2016 at 12:52 am

      “If the average drug-free lifter has a FFMI of 22.3, then shouldn’t that be the point at which the odds of someone being drug-free is 50%?”

      Nah. Because odds are way lower than a user would wind up with an FFMI of only 22.3 (a little more than 1SD below the mean). So if you found someone with that FFMI, they could either be a very average nonuser (very common) or a user who’s way below average (much less common), so you’d expect the odds to be well above 50%.

      Reply
  2. Tulu says

    November 24, 2016 at 12:53 pm

    I’m trying to set up the graph on page 3 so that a random person FFMI of 18.9 has a >99% chance of being natty, and a random person with a FFMI of 22.3 has a 50% of being natty, but I can’t seem to get that to work.

    I think this would make the most sense, since the average person (18.9 ffmi) is almost certainly natty (well over 99% of people aren’t on anabolics), and if the average trained individual can achieve a FFMI of 22.3, then that should be the point where a greater score means it’s more likely than not you’re on drugs. The gap between the average trainee and the average untrained person is about 3.4 points, and if you add 3.4 points to the average trainee you get a FFMI score 25.7, which should be the point at which you have a less than 1% chance of being natty. This set up makes intuitive sense to me, but I can’t figure out how to get this to play out on the spreadsheet. Help?

    Reply
    • Greg Nuckols says

      November 25, 2016 at 12:52 am

      See my response to your other comment. That’s the wrong set of assumptions.

      Reply
      • HC says

        November 25, 2016 at 10:31 am

        I wonder if you have reviewed some of these experimental observations:
        1. In a placebo controlled study of 61 healthy young non-competitive weight lifters with similar diet and with normal testerone levels, there was a significant relationship between administered testosterone dose and leg press strength (1). At the highest dose, leg press 1 RM increased by about 17% over a 20 week treatment period. It should be pointed out that this significant gain was acheived with the subjects performing NO strength training excercise.

        2. In young men treated with supraphysiologic doses of testosterone over 10 weeks, squat 1 RM increased by about 20 percent, similar to a control group that performed resistance exercise and received placebo. In a separate group that also performed resistance excercise, the squat 1 RM increased by 38% (2).

        These findings suggest a drug effect much higher than your calculations would suggest.

        1) Testosterone dose-response relationships in healthy young men

        Shalender Bhasin, Linda Woodhouse, Richard Casaburi, Atam B. Singh, Dimple Bhasin, Nancy Berman, Xianghong Chen, Kevin E. Yarasheski, Lynne Magliano, Connie Dzekov, Jeanne Dzekov, Rachelle Bross, Jeffrey Phillips, Indrani Sinha-Hikim, Ruoquing Shen, Thomas W. Storer
        American Journal of Physiology – Endocrinology and Metabolism Published 1 December 2001 Vol. 281 no. 6, E1172-E1181 DOI:

        2. N Engl J Med. 1996 Jul 4;335(1):1-7.
        The effects of supraphysiologic doses of testosterone on muscle size and strength in normal men.
        Bhasin S1, Storer TW, Berman N, Callegari C, Clevenger B, Phillips J, Bunnell TJ, Tricker R, Shirazi A, Casaburi R.

        Reply
        • Greg Nuckols says

          November 25, 2016 at 1:17 pm

          Yep, I looked into those two studies in my previous steroid article (linked at the top of the post), and their findings are very much in line with what I’m proposing here.

          Reply
          • hc says

            November 26, 2016 at 7:42 am

            Not exactly. These studies find a closer to 20% advantage using only one drug at prescribed doses for a limited time. The cornucopia of performing enhancing drugs (PED) is now immense, and combinations of such probably (my speculation) lead to even greater gains.

            There is a larger point to be made.

            Most seem to believe that PED merely reward generously users who are otherwise working hard at their craft (you read this opinion all of the time). The sad part is that while many “pure” lifters argue over which training method is best, those who drug the most and train the least may achieve a similar result. As an example, in the NEJM study the gains of the training-placebo group were almost identical to the drug-without exercise group.

          • Greg Nuckols says

            November 26, 2016 at 10:57 pm

            I’d assume there’s a limit to how long that effect would hold, though. I mean, there are people who bench 500 and squat 700 without drugs. I don’t think someone could just juice their way to those numbers without training. Though I definitely agree that drugs will increase the results someone gets from any form of training.

  3. Chem says

    November 26, 2016 at 1:31 am

    Greg, I’m a pretty big fan of yours, though I would consider myself more of a bodybuilder who trains primarily with heavy(ish) compounds.

    I’m pretty well versed when it comes to AAS usage. I have personally used Testosterone, Nandrolone, Trenbolone, Boldenone, Methenolone, Drostanolone, Oxandrolone, Oxymetholone, Methandienone, Stanozolol, Fluoxymesterone, Mesterolone, Methyltrienolone, Methylstenbolone, Dymethazine, Epistane, Methasteron, and Methyl-1-Testosterone.

    There is a pretty decent amount of literature available regarding the strength-increasing and myotrophic capabilities of compounds like Testosterone, Nandrolone, and to a lesser extent Oxymetholone and Methandienone.

    But what about DHT-derivatives, which have been demonstrated to have a marked impact on CNS efficiency, or compounds like Trenbolone, Anavar, Halotestin, Epistane, etc. that are capable of causing profound increases in strength without a proportional increase in weight?

    I can certainly believe your analysis and data as applied to Testosterone/Nandrolone, but believe me, if I took a natty lifter, and put him on something like:

    125mg Testosterone Enanthate/wk
    400mg Trenbolone Enanthate/wk
    600mg Masteron Enanthate/wk

    plus any of the following:

    100mg Anavar ED
    100mg Epistane ED
    10-20mg Halotestin ED
    1-2mg Methyltrienolone ED

    I can guaran-damn-tee you that you’d see an increase in total, even using an isocaloric diet with minimal-to-no weight gain, of at least 150-200lbs over an 8 week period.

    The potential exists to develop a staggering strength-to-weight ratio without much mass gain, especially if using something like high doses of Trenbolone and Methyltrienolone together. This stack was absolutely retarded when it came to how often and by what degree I was setting PR’s, yet weight gain was negligible.

    What are your thoughts on this?

    Reply
    • Greg Nuckols says

      November 26, 2016 at 10:51 pm

      I wonder if there’s a difference there between normal lifters and elite lifters.

      Because, when I look at just the lifters who I know well enough to be 99.9%+ sure they’re actually drug-free, the 10% seems to hold pretty well. For example, Bryce Lewis has totaled 1918 at 231 (easy water cut to 220 with a 24 hr weigh-in) without wraps and without a DL bar. The 220 records are 2101 without wraps, and 2193 with wraps, both with DL bars. Knock 10% off of those, and you’re at 1891 without wraps and 1974 with wraps. If the boost is considerably bigger than 10%, then Bryce is just a dramatically better lifter than the other guys (which, I suppose, is entirely possible). Of course, in that scenario, 10% coincides with about 200lbs, so it may be that it’s more of an absolute 150-200lb gain across the board, instead of a gain of a proportional gain relative to where you start (i.e. boosting a 2000 total to 2200 and a 1000 total to 1200, instead of 2000 to 2200 and 1000 to 1100), which would coincide with around 10%ish for elite lifters totaling the neighborhood of 2k, but a substantially higher percentage for someone starting with a lower total.

      I’d be interested to know if you have citations on had for this statement:

      “But what about DHT-derivatives, which have been demonstrated to have a marked impact on CNS efficiency, or compounds like Trenbolone, Anavar, Halotestin, Epistane, etc. that are capable of causing profound increases in strength without a proportional increase in weight?”

      I’ve heard that as well, but couldn’t actually find any citations to support it. Do you happen to have them on hand? I wonder, at this point, how much of that effect is placebo. Certainly not saying those compounds themselves are placebos, but since people “know” they increase strength a lot, I wonder if that contributes. Because we know from placebo research that just thinking you’re on steroids can cause an instant 4-5% boost in strength (source), and that just thinking you’re on steroids can increase rate of strength gain by 7-8 fold (source). With that in mind, when people take compounds they expect to increase strength, it’s hard to know how much of the subsequent increase can be attributed to the drugs, and how much can be attributed to expectancy effects – we’d need a placebo-controlled study to tease that apart, which I don’t think we’re going to see any time soon.

      Reply
      • Chem says

        November 26, 2016 at 11:28 pm

        Damn, well you got me on the ‘elite-lifters’ point.

        I suppose I’m so used to thinking of strength progress in terms of flexibly-linear because I’m nowhere near that upper-echelon where it becomes a feat to add 5 pounds on your bench. It’s been my experience that running moderate doses of the compounds I specifically mentioned while training the major lifts two to three times a week has allowed me to continue linearly adding ~10lbs to my total a week. But put in perspective, it seems a bit ridiculous to expect that to continue once your total cracks ~1500-1700ish.

        As for the claim about DHT-derivatives and potent androgens increasing neuromuscular efficiency, there’s not a TON of direct literature which I can draw from, but here are a few:

        Neuroregenerative Effect of Oxandrolone: A Case Report.
        https://www.ncbi.nlm.nih.gov/pubmed/26502938

        “CONCLUSIONS:
        Data ensuing from this single case-report suggest that anabolic androgenic steroids have a potential neuroregenerative effect, with an inherent improvement in neuromuscular efficiency through an increased myelin synthesis at peripheral nervous system site.”

        Hormone sensitivity of muscle activation in the sexually dimorphic SNB/BC neuromuscular system of the rat
        http://www.sciencedirect.com/science/article/pii/S0304394004001594

        “Castration reduced recruitment amplitude and increased response latency, and treatment with estradiol or the non-aromatizable androgen dihydrotestosterone prevented these changes. Dihydrotestosterone, but not estradiol, maintained BC muscle mass. These results indicate that functional changes in the SNB/BC circuit can result in part from hormonal sensitivity in the neuromuscular periphery and are independent of muscle mass.”

        Androgens for stimulating the central nervous system and for treating osteoporosis
        http://www.google.ch/patents/CA2113425C?cl=en&hl=de

        “This research completely unexpectedly and surprisingly revealed a hitherto unknown further action of mestanolone, namely that the supply thereof led to an optimization of central nervous system activation during preparation for the task and also led to maintenance of this optimum activation even under high stresses. Thus, subjects exhibited increased psychophysiological capacity.
        Fifty-four subjects who were highly stressed for a long period of time had, after the administration of 10 mg of mestanole daily, a marked increase in alpha-frequency by up to 4 Hertz. This was associated with a regularizing and optimizing of the frequency rise under stress. The subjects performed difficult exercises requiring high physical capacities linked with high intellectual concentration and muscular coordination with far fewer errors. Complicated movement sequences with a high degree of stressing did not lead to a reduction in the degree of activation but, instead, the increased capacity remained after several repeats.”

        Pls write more on sterons <3

        Reply
        • Greg Nuckols says

          November 27, 2016 at 4:55 pm

          Thanks for the links!

          Just skimming them, they mostly seem to be saying that low androgen levels cause issues, or that androgens can be used to treat some neurological diseases. That’s a bit different from extra androgens causing further improvements in people with normal androgen levels, and without disease.

          One reason I’m skeptical of a huge neurological effect is that normal people are already pretty darn good at fully activating their muscles. Here’s one example (relevant screenshot from results table). At all joint angles, even untrained participants were capable of reaching very close to full activation.

          For androgens to have an additive effect, either:

          1) they’d need to increase muscular force independent of size via some mechanism in the muscle itself (i.e. maybe increased myofibrillar density?) or

          2) they’d need to increase absolute degree of skill acquisition (i.e. how well they can use their muscles to move a load, independent of their ability to simply fully activate a muscle).

          The second one seems more likely to me, since androgens have been shown to improve spatial reasoning skills and coordination in some studies (but again, on people with initially low androgen levels), and that could potentially explain huge jumps for intermediate level lifters (still the potential for a lot of strength gains via skill acquisition, with steroids potentially speeding up that process). However, I’d need to see something indicating that they not only increased rate of motor skill acquisition, but also increased the peak level of attainable motor skill development (so again, maybe a difference in effects between elite and sub-elite people).

          Reply
  4. Dennis says

    November 29, 2016 at 2:33 am

    In the spread sheet predicted totals are significantly higher than your previous calculator (non-user part) here:
    http://strengtheory.com/your-drug-free-muscle-and-strength-potential-part-1/

    Is there a reason for that or am I doing something wrong?

    And also FFM/cm is fixed to FFM/180. Should I change it to FFM/C4 ?

    Reply
    • Greg Nuckols says

      November 29, 2016 at 2:54 pm

      “And also FFM/cm is fixed to FFM/180. Should I change it to FFM/C4?”

      Yep! Sorry. Thanks for the catch. Fixed in the main spreadsheet now.

      “Is there a reason for that or am I doing something wrong?”

      That depends on your wrist and ankle circumferences. The calculator other article got the FFM/cm from *your* predicted muscular potential, and the calculator in this spreadsheet just uses population averages.

      Reply
      • Dennis says

        November 30, 2016 at 4:15 am

        Thanks a lot Greg. After reading your previous article again I have realized that you have proposed two equations for total prediction. One for geared :
        Total = 1563.9(FFM/cm)+77.32
        And one for raw:
        Total = 1448.53(FFM/cm)+77.32
        After I changed the first one in the spreasheet with the second one results got smaller. Now I can sleep in peace.

        Reply
        • Greg Nuckols says

          November 30, 2016 at 4:47 am

          Ohhh yeah, totally forgot I did that in the previous article. I left it with 1563.9 for this one just so no one could accuse me of fiddling with the data to skew the results in one way or another (going with 1448.53 instead of 1563.9 would present a smaller relative advantage for steroid usage, since each increase in FFM/cm would be “worth” less), but you’re totally right. It was 1448.53 in the other article.

          Reply
          • hc says

            December 5, 2016 at 12:13 pm

            Although FFM index is a useful construct, I wonder if anyone has experience to the distribution of muscle using Inbody (impedence):

            http://www.inbodyusa.com/pages/products ?

Trackbacks

  1. Periodization:  History and Theory • Stronger by Science says:
    August 22, 2017 at 1:26 am

    […] it, of course, but the USSR did it first and probably did it best). When you examine the research, drugs and differences in innate talent make a much larger difference in performance than choosing one […]

    Reply
  2. Periodization:  History and Theory • Stronger by Science - Men's Fitness & Lifestyle says:
    February 25, 2018 at 8:23 pm

    […] it, of course, but the USSR did it first and probably did it best). When you examine the research, drugs and differences in innate talent make a much larger difference in performance than choosing one […]

    Reply

Leave a Reply Cancel reply

You have to agree to the comment policy.

Read Next

  • There’s Finally Research on Safety Bar Squats
  • Are Nitric Oxide Supplements Beneficial For Strength and Hypertrophy?
  • Q&A with Eric Trexler,
    Our New Director of Education
  • A Thorough Breakdown of the “Extreme Volume Study”
  • About
  • Terms
  • Privacy
  • Contact

Copyright © 2019 · Altitude Pro Theme On Genesis Framework · WordPress

loading Cancel
Post was not sent - check your email addresses!
Email check failed, please try again
Sorry, your blog cannot share posts by email.