
Key Points:
- A ton of factors influence strength beyond muscle size and skill with the movements used to test strength. The strength of individual muscle fibers, normalized muscle force, muscle moment arms, and body proportions can all have significant, independent effects on strength.
- Just as there’s massive variability in muscle growth – some people gaining a ton of muscle in response to training, and other people gaining very little – there’s massive variability in strength gains as well. Normalized muscle force (how strong a muscle is relative to how large it is) can increase up to 39% for some people and decrease by as much as 5% for others, in response to the exact same training program.
- Early on in training, there’s a very weak relationship between gains in muscle and gains in strength. Gains in muscle mass may explain as little as 2% of the variation in strength gains for new lifters.
- For more experienced lifters, gains in muscle mass may explain up to 65%+ of the variability in strength gains, highlighting hypertrophy as a key factor for strength gains in trained lifters.
- Training style has a big impact on the ratio of strength you gain relative to size, with heavier training generally producing larger gains in strength.
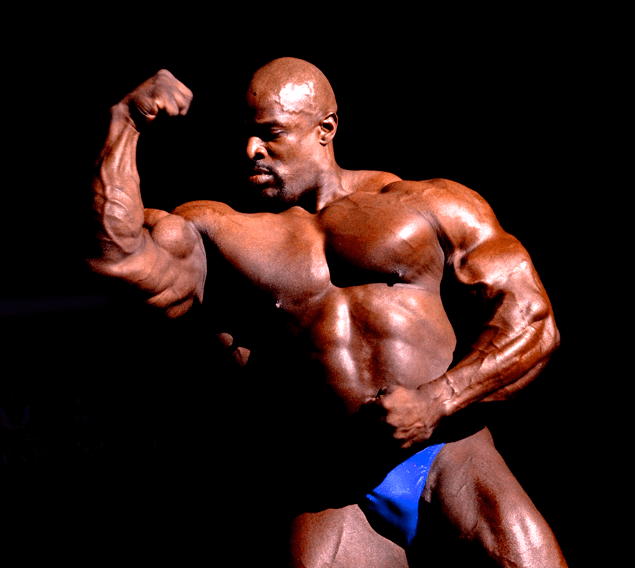
If you’ve spent much time in the gym, I’m sure you’ve witnessed a scene very similar to this one:
There’s a big guy in the squat rack busting out reps with 405 lbs, making each rep look like a herculean effort.
In the rack right beside him, there’s a smaller guy with smaller legs repping the same weight, making it look like a piece of cake.
If you haven’t seen it on the squat, then you may have seen it with the bench press or deadlift. And if you’ve never seen anything like this – trust me, you will at some point.
At first, this may seem confusing. After all, muscles produce the contractile force to move weight, so the guy with more muscle should be able to move more weight, right? How can a guy who only weighs 163lbs deadlift 684lbs, when there are plenty of much larger men who would be thrilled to just crack the 500 or 600lb barrier?
Or how can a guy who weighs 187lbs bench press 451lbs, when plenty of people with more upper body musculature are still struggling to crack 400lbs, or even bench 315lbs for the first time?
Or how can a 17-year-old kid who weighs 170lbs squat 562lbs for an easy set of 3, even though most lifters who weigh a lot more would kill to hit those lifts?
It’s simple: There’s a LOT that contributes to strength beyond muscle mass.
Now, it’s impossible to pin down exactly how much muscle mass influences strength because that would require a 20-year training study that would be utterly unfeasible to carry out. However, we can get ourselves in the right ballpark. Here’s what I mean:
The average male weighs around 80kg. In an untrained male, about 40% of their body mass is skeletal muscle, meaning that pre-training, the average person starts with around 32kg of muscle mass.
Though there’s plenty of variability, let’s just say the typical person can increase their muscle mass by about 50% after a decade of hard training, for a gain of 16kg. Maybe they add 7-8kg in the first year, 2-3 kg for a couple of years, and then scrap away for marginal gains for the rest of the decade – a pretty typical time course for muscle growth.
However, while they’re increasing their muscle mass by 50%, they probably also increase their strength between 2- and 4-fold. Generally, the relative increase in strength will be a bit smaller for isolation lifts, and a bit bigger for more technical compound lifts. Maybe they could strict dumbbell curl 10-15kg their first day in the gym, and they can eventually curl 20-30kg. Or maybe they could squat 50kg their first day in the gym, and they can eventually squat 200kg. The exact numbers aren’t important, and they may not match your particular experience, but I hope everyone reading can agree that these numbers are comfortably within the realm of “normal.”
In the case of the curl, their strength increased 2-fold, and in the case of the squat, their strength increased roughly 4-fold while their muscle mass only increased by 50%. In other words, they gained 4-8x more strength than muscle.
The gain in muscle mass certainly played a role, but it can’t come anywhere close to explaining all of the increase in strength, or even most of it.
In this article, I want to dig into two initially confusing observations and one general question:
- Sometimes, people with less muscle lift way more than people with more muscle. Some people gain proportionately more strength in response to training, while others gain proportionately more muscle, even on identical training programs. What explains the divergence?
- On the individual level, you gain way more strength than muscle mass across a training career because strength generally increases faster than muscle mass. If muscles are what produce the force necessary to lift heavy stuff, why would strength gains outstrip gains in muscle mass 4- to 8-fold?
- What is the overall relationship between gains in muscle mass and gains in strength?
Let’s start from the most basic level – individual muscle fibers – and work up from there. Strap in and buckle up, folks. This is going to be a pretty dense read.
Individual Muscle Fibers
Larger muscle fibers generally produce more force than smaller muscle fibers, which shouldn’t be much of a surprise.
However, while absolute strength of muscle fibers tends to increase with fiber size, relative strength tends to decrease.
The most common metric to assess relative strength of a muscle fiber is called “specific tension.” Specific tension is maximal force divided by cross-sectional area.

We know that specific tension (force production per unit of cross-sectional area) can vary dramatically between muscle fibers.
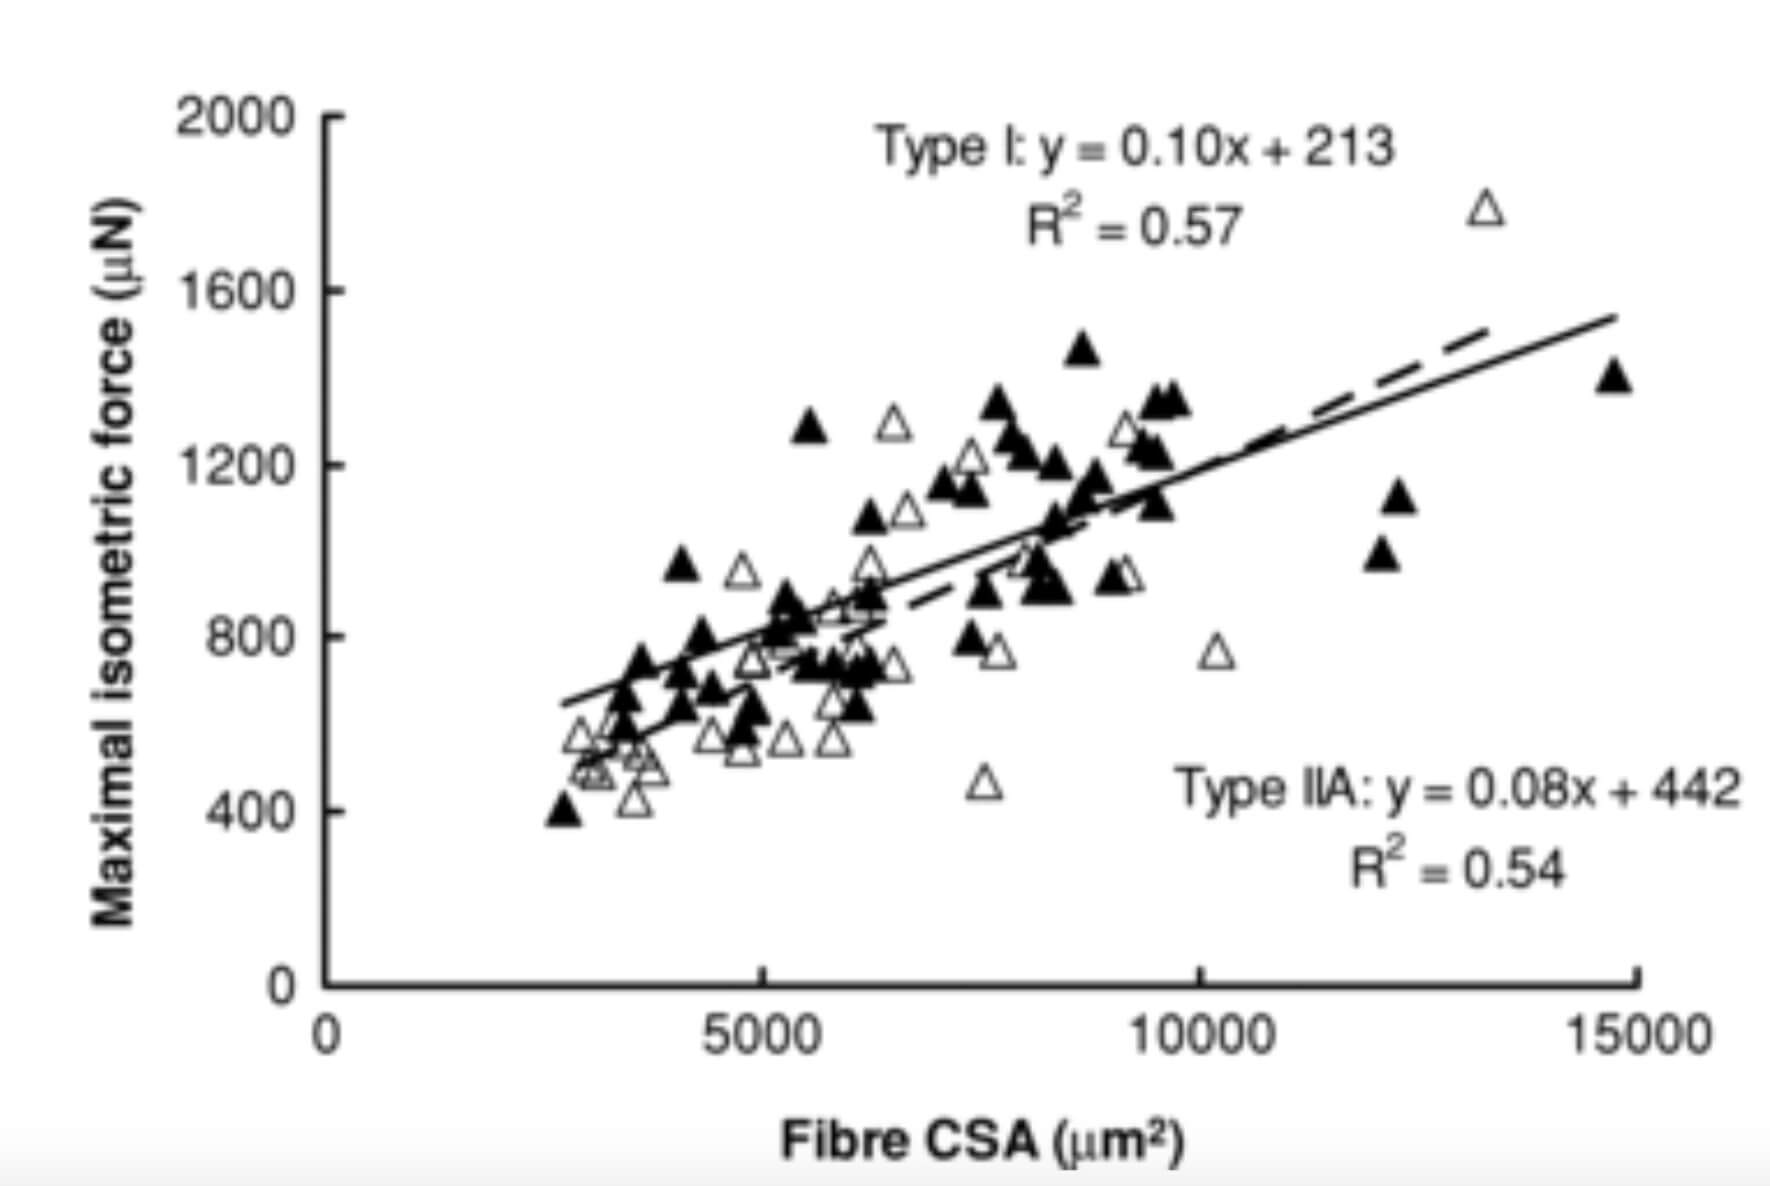
In this study, the specific tension of bodybuilders’ muscle fibers was 62% less than power athletes’ muscle fibers, and 41% less than the fibers of untrained control subjects. In this study, there was a 3-fold difference in specific tension between the fibers with the most and least relative strength. That’s huge. Both of these studies also found that specific tension tended to decrease as fibers got larger, corroborated by this huge study which found that contractile force of single muscle fibers scaled with muscle fiber diameter rather than cross-sectional area.
This means that specific tension tends to decrease as fiber size increases, since cross-sectional area (which is proportional to the square of the diameter) increases faster than diameter. For example, if the cross-sectional area of a muscle fiber doubled, you’d expect it to produce 41% more force, not twice as much.
Put another way, cross-sectional area = π x (diameter/2)2, so a doubling of diameter would increase cross-sectional area 4-fold. While cross-sectional area increased 4-fold, you’d only expect force to double to match the doubling in diameter, for a 50% reduction in specific tension.
However, this relationship was discovered in a cross-sectional study, and data from longitudinal studies show that fiber-specific tension is unaffected by training, or may even increase. In other words, your biggest muscle fibers probably have lower specific tension than your smallest muscle fibers right now, but as you train, the average specific tension of your muscle fibers either remains the same or increases slightly.
In this study, for example, muscle fiber cross-sectional area increased by roughly 30% over 12 weeks of training, but specific tension didn’t change. The results of this study were similar: 28-45% increases in muscle fiber cross-sectional area after 12 weeks without a change in specific tension. These two studies (one, two), on the other hand, showed an increase in muscle fiber specific tension in the absence of muscle growth. In all four of these studies, force relative to fiber diameter increased, but force relative to cross-sectional area only increased when the muscle fibers didn’t grow.
It may be tempting to assume that the differentiating factor was the length of the training intervention (12 weeks in the first two studies showing no change in specific tension, versus 1 year in the last two where specific tension increased), but this study shoots a hole in that idea. The specific tension of experienced lifters’ (average 7.6 years of training experience) muscle fibers was the same as that of untrained controls. On the whole, it seems like the specific tension of individual muscle fibers may increase in response to training if the muscle fibers don’t get any bigger. However, assuming your muscle fibers do grow, their specific tension will likely remain unchanged, though your larger muscle fibers’ specific tension will still be lower than your smaller muscle fibers’.
For now, we know that there can be pretty huge differences in muscle fiber specific tension between individuals (remember, it was 61% higher in power athletes’ muscle fibers vs. bodybuilders’), which may help partially explain our first conundrum: the scrawny guy out-lifting the jacked guy. We also know that muscle fiber specific tension can vary up to 3-fold between muscle fibers within individuals. However, muscle fiber specific tension doesn’t seem to be overly affected by training, especially when muscle growth takes place, so it doesn’t do much to shed any light on our second conundrum (gaining a lot more strength than muscle mass across a training career).
It may be tempting to assume that specific tension increases with heavy/explosive training and decreases with higher volume, lower weight bodybuilder-style training, but the best we have to support that notion is hints from cross-sectional research, rather than direct evidence from longitudinal research. It may just be that having muscle fibers with higher specific tension predisposes you for success in power sports, and that having muscle fibers with lower specific tension predisposes you for success in bodybuilding (perhaps having muscle fibers that are relatively weaker allows you to tolerate higher training volumes with lower injury risk because each contraction is relatively less forceful).
Next, let’s look at the level of the muscle.
Whole Muscles and Single Joints
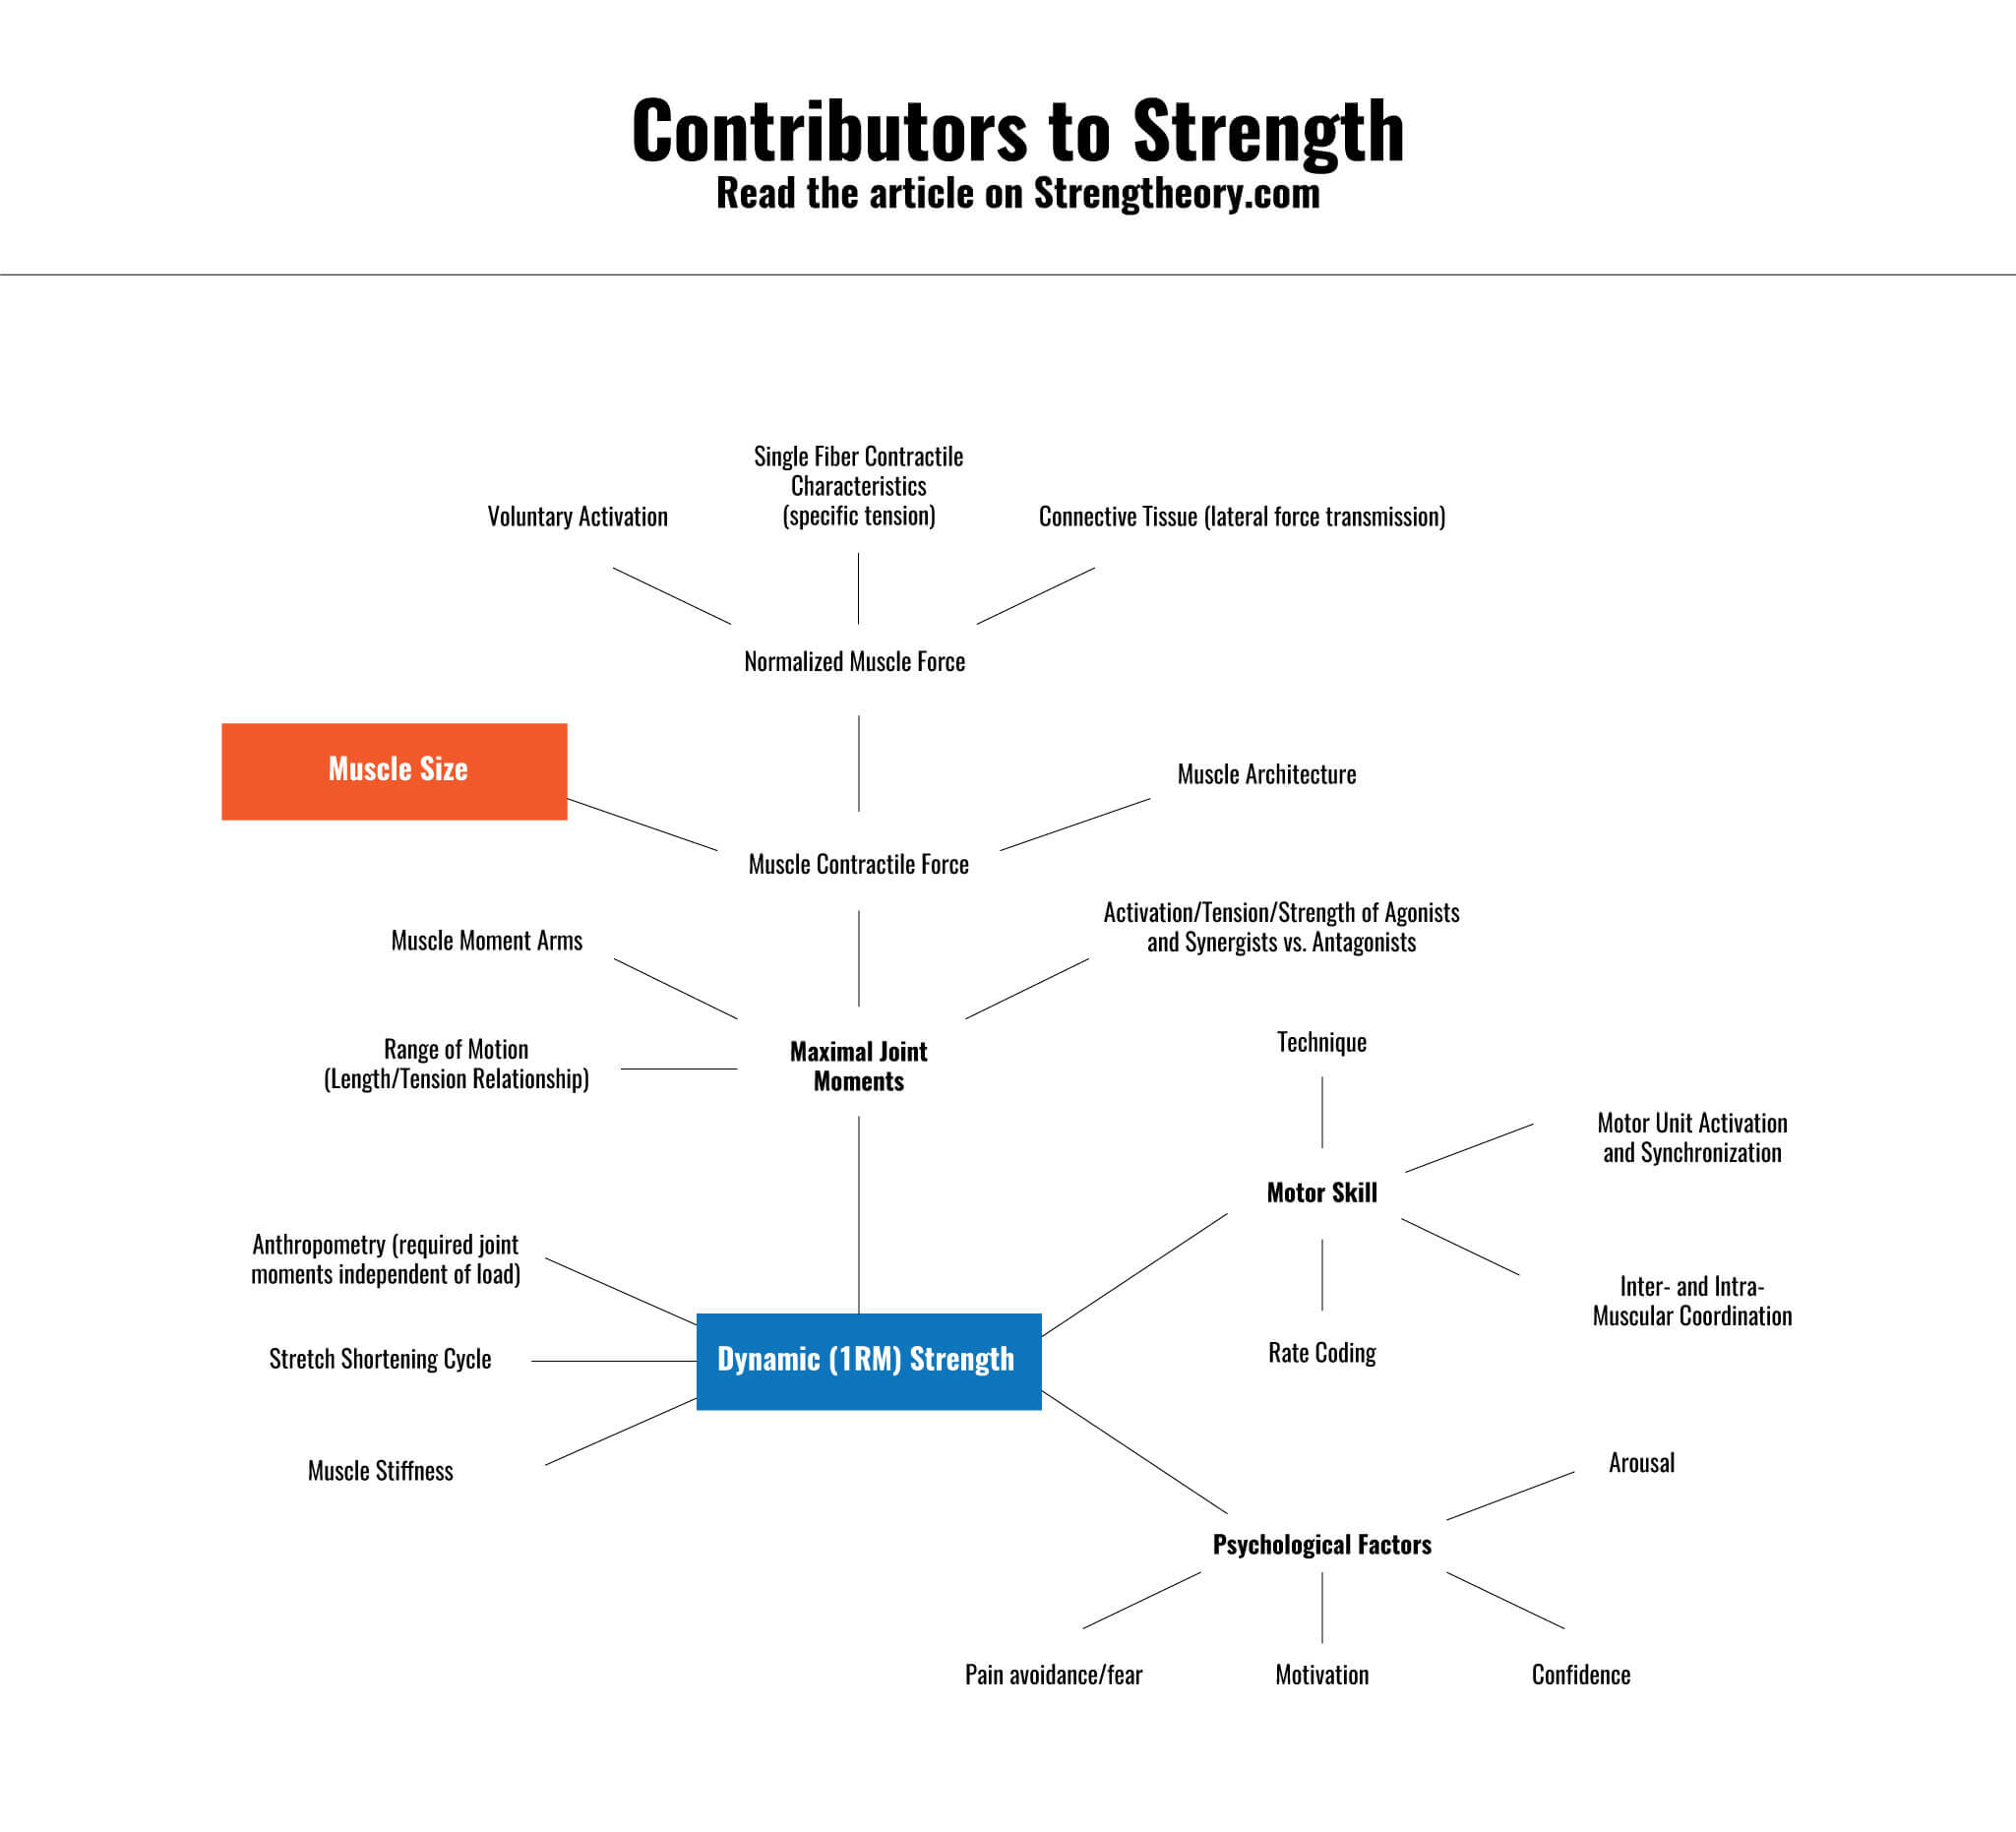
There are three primary factors that determine how much torque a muscle can produce at a joint:
- The maximum contractile force that a muscle can exert on a bone. Maximal contractile force depends on the size of the muscle itself, potentially its muscle architecture, and the amount of force it can produce per unit of size.
- Whether the nervous system can adequately activate all or most of the motor units in the muscle, and suppress activation of antagonistic muscles.
- The attachment points of the muscles.
I’ll address these three factors in reverse.
Attachment Points
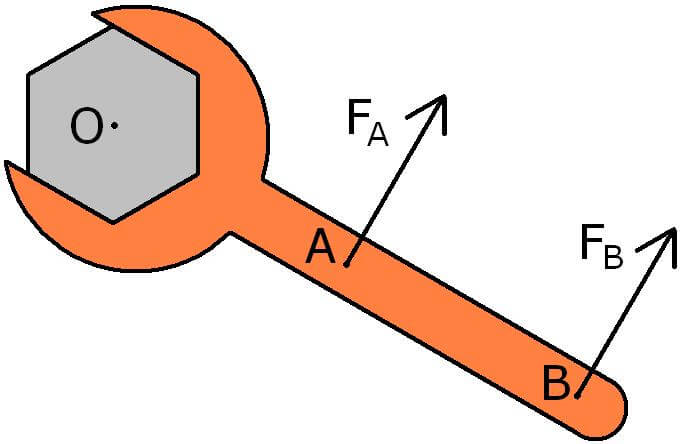
When muscles contract, they pull against bones, creating moments (or torque, if you prefer) at the joints they cross. The magnitude of the joint moment is determined by the force of contraction and the length of the muscle moment arm. If you compare two people whose muscles contract with the exact same amount of force, the person with the longer muscle moment arm will be able to produce a larger maximal joint moment. (If you’re murky on joint moments, check out this quick refresher.)
There’s considerable variability in muscle moment arms. For example, in this study, the average muscle moment arm for the quads was 40.2±3.5mm. If someone’s quads contract with 5000N of force, and their quads have a muscle moment arm of 40.2mm, they’ll be able to produce a knee extensor moment of 201Nm. With a muscle moment arm of 43.7mm (+1 standard deviation), they’ll produce a knee extensor moment of 218.5Nm with the exact same 5000N of force from the quads. If, on the other hand, their muscle moment arm was only 36.7mm (-1 standard deviation), they’ll produce a knee extensor moment of just 183.5Nm.
In other words, if you compared two people whose quads were the exact same strength, but one of them had a muscle moment arm that was 1SD larger than normal, and the other had a muscle moment arm 1SD shorter than normal (a “fortunate” moment arm for strength vs. an “unfortunate” one, but certainly not outliers), the person with the longer muscle moment arm would be able to produce a 19% larger knee extensor moment. Variation in muscle moment arms isn’t the difference between an average Joe or Jane and a world-class athlete, but it’s been shown to account for roughly 16-25% of the variability in men’s knee extension strength. Furthermore, Delp demonstrated that variation in hip joint placement could have a pretty big impact on muscle moment arms for hip flexors, extensors, adductors, and abductors as well.
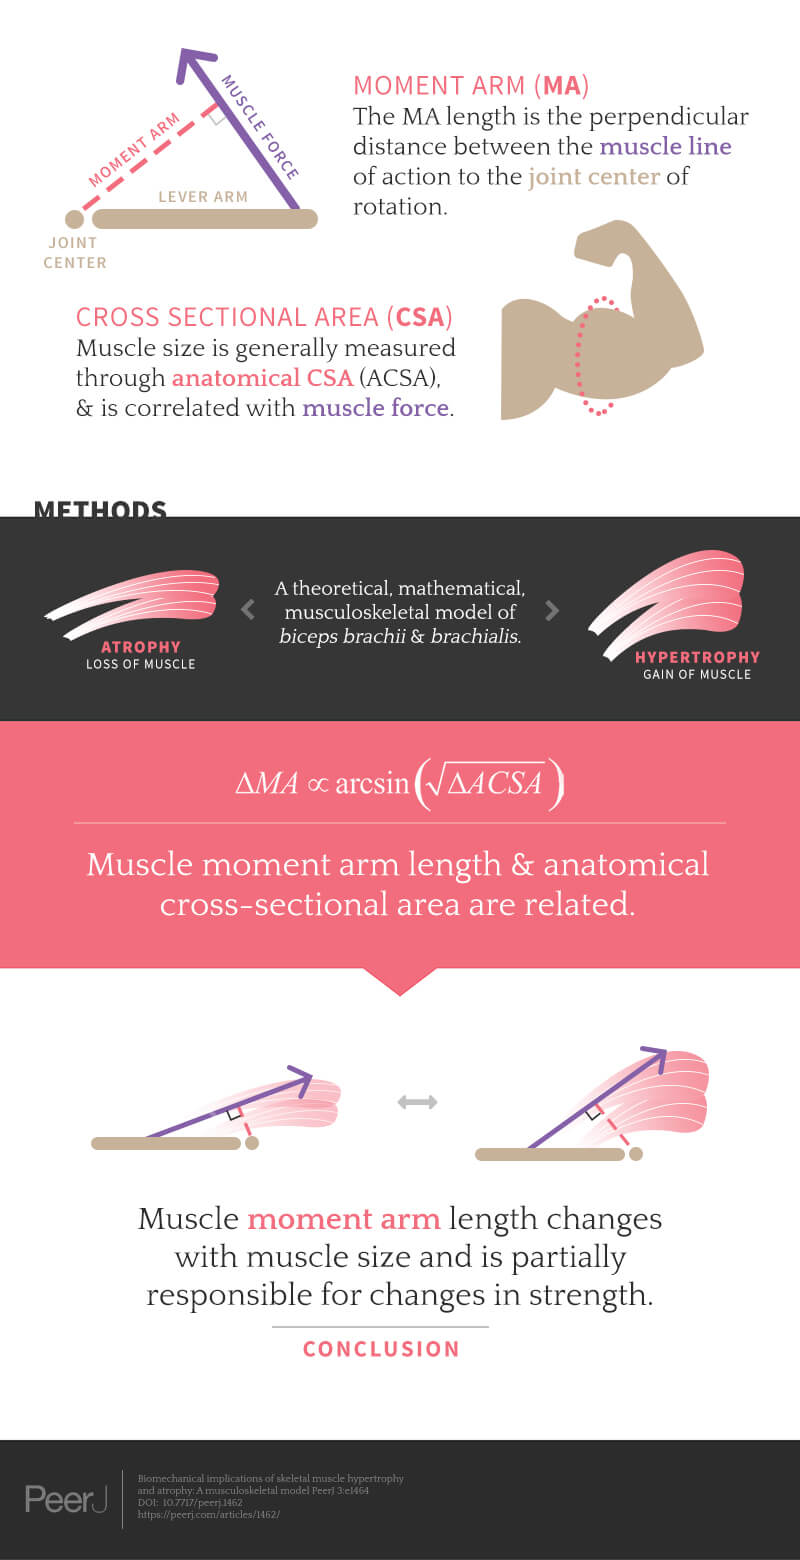
Furthermore, as muscles grow, their muscle moment arms tend to get longer in the process at most joints and joint angles (but not all). The attachment point doesn’t change, but the line of pull changes and the middle of the muscle where it crosses the joint (which is where you’d measure the muscle moment arm) gets farther from the joint center. A recent modeling study by Andrew Vigotsky demonstrates this beautifully.
The variability in muscle moment arms helps explain our first conundrum (a smaller guy out-lifting a larger guy), while the lengthening of muscle moment arms with hypertrophy helps explain our second conundrum (gaining disproportionately more strength than muscle mass across a training career).
Muscle Activation
A lot of people have the notion that, under normal conditions, you can only access a portion of your strength, and that when the situation calls for it (i.e. maybe you see a loved one trapped under a car), you have an extra reserve of strength just waiting to be unleashed if enough adrenaline is coursing through your veins.
Unfortunately, that’s probably not the case.
Under lab conditions, you can test to see how much of their strength a person is capable of “accessing.” You have them produce the most force they possibly can (voluntary contraction), and then you electrically stimulate the muscle to force every single muscle fiber to contract as hard as possible (evoked contraction).
Voluntary contractions are almost always 90%+ as forceful as evoked contractions, typically 95%+ as forceful, and sometimes 100% as forceful, even in untrained people. There’s simply not much room for improvement.
Keep in mind that we’re talking about single muscles or muscle groups here. It very well may be true that motor unit recruitment increases with training experience in compound lifts. I’m honestly not sure if that’s been studied, or even if it could be studied, other than via EMG, which is a little messier than most people realize. 1EMG in dynamic contractions often increases with training, but the changes may be due to increases in intracellular calcium, which could affect EMG signals independent of changes in motor unit recruitment.
Comparing voluntary contractions to evoked contractions for something like isometric curls or knee extensions is easy, but maximally stimulating someone’s quads, glutes, hamstrings, and adductors while they were attempting a 1rm squat would be a recipe for disaster. However, when dealing with the strength of a single muscle or muscle group, it doesn’t seem that increasing muscle activation would net big strength gains for many people because most people activate their muscles very effectively in the first place.
Maximum Contractile Force – Dependent on Size and Architecture
The rest of the variability not explained by variations in muscle moment arms and (slight) variation in muscle activation must be explained by the intrinsic ability of a muscle to produce force.
There are a lot of things that contribute to muscular force production, including the size of the muscle (anatomical cross-sectional area, or ACSA), muscle architecture (fascicle length and pennation angle), degree of muscle activation (which likely doesn’t affect things too much for most people), and specific tension of individual muscle fibers (as already discussed).
The correlation between ACSA and muscular force and/or joint moments is typically around r=0.7-0.75, meaning muscle size only explains about 50% of the variability in force production. Other architectural factors (such as fascicle length and pennation angle) don’t correlate quite as strongly (r=0.3-0.45), explaining about 10-20% of the variation. However, fascicle length and pennation angle also tend to increase with hypertrophy, so it’s less clear whether they independently influence contractile strength (and if they do, their contribution is pretty weak anyways; in fact, Erskine showed that changes in pennation angle and fascicle length may be weakly negatively correlated with strength gains).
Maximum Contractile Force – Independent of Size and Architecture
So, muscle size and muscle architecture explain roughly 50-70% of the variation in muscle contractile force. The rest, then, depends on factors that affect muscle strength independent of muscle size. There’s a tidy concept to explain this: Normalized Muscle Force (NMF).
NMF is very similar to specific tension. Specific tension is the amount of force a muscle fiber can produce relative to its cross-sectional area, and NMF is the amount of force a whole muscle can produce relative to its cross-sectional area.
Most (but not all) studies show that NMF increases in response to training. This is in contrast to single fiber specific tension, which doesn’t tend to increase with training. Therefore, something is allowing the muscle to produce more force without an increase in the force-producing capability of the individual muscle fibers, and (generally) without an increase in muscle activation. How’s that for a brain teaser?
The most likely explanation for the discord between muscle fiber specific tension and NMF is an increase in connective tissue and membrane proteins, allowing for lateral force transmission from a muscle fiber to surrounding connective tissue. This would allow more total force to reach the tendon with the same strength of contraction for each muscle fiber.
Up to 80% of the contractile force of each muscle fiber can be transferred to its surrounding connective tissue via specialized proteins linking each fiber to the muscle’s fascia (endomysium, perimysium, epimysium, etc.). This force can then be transferred to the tendons, adding to the force delivered to the tendon directly from each muscle fiber at the musculotendinous junction. We can see this effect in action in studies that report both fiber specific tension and NMF (both of which are force output divided by cross-sectional area). For example, in this study, NMF was approximately 23% higher than fiber specific tension pre-training, and approximately 36% higher post-training. The muscle can produce more force per unit of size than the individual muscle fibers can, because that force can be more efficiently transmitted to the tendons via connective tissue attachments.
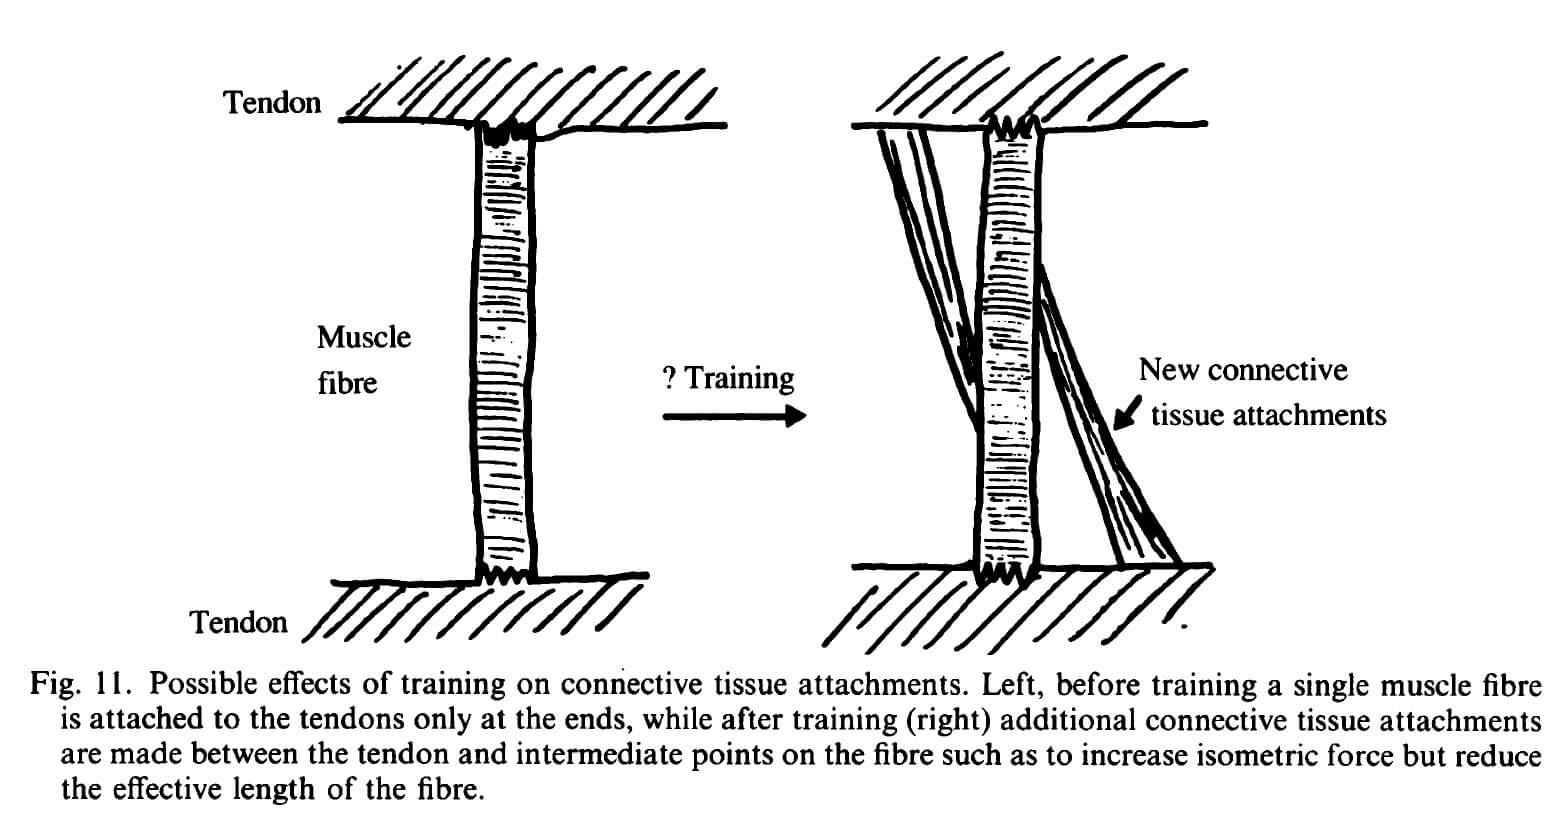
This idea that increases in NMF could be explained by increases in lateral force transmission was theorized as early as the ’80s (the image above was from a great 1989 review article), but it doesn’t have direct experimental support yet. We know that lateral force transmission happens, but we don’t yet know if it increases as a result of training. However, a 2010 study by Erskine lends support to this position.
Enhanced lateral force transmission via increased connective tissue offshoots would allow for more efficient force transmission between the muscle fibers and the tendons, but it would also decrease the effective length of the muscle fibers. Therefore, you’d expect relative power (power output normalized to muscle volume) to decrease.
In this study, no performance metrics changed at the muscle fiber level: The participants’ muscle fiber specific tension, peak power, and shortening velocity didn’t change.
NMF, on the other hand, increased by 17%, while whole muscle power normalized to muscle size remained the same. Power = Force x Velocity, so if relative force increased 17% while relative power didn’t change, relative shortening velocity must have decreased by 17%.
All of those findings are consistent with the lateral force transmission hypothesis: no changes on the level of individual fibers, but an increase in the whole muscle’s ability to produce force independent of muscle size, accompanied by a decrease in shortening velocity.
It will take direct studies of those connective tissue offshoots and changes in membrane proteins (like dystrophin) to confirm the hypothesis, but at the moment, it seems to be the most likely explanation for the increase in NMF in response to training.
As with every other factor we’ve discussed thus far, there’s plenty of variability in NMF and NMF changes. In this particular study (which is in line with most of the literature on the subject), the increase in NMF was 17±11%, meaning quite a few people could expect an increase in muscle force independent of muscle size of 28% or more, while some people will only see an increase of 6% or less. Furthermore, post-training NMF was 30.3±6.7N/cm2, meaning that if your muscles’ NMF was 1 standard deviation better than average (37N/cm2), you’d produce 57% more force per unit of muscle cross-sectional area than someone whose NMF was 1 standard deviation worse than average (23.6N/cm2).
Furthermore, training style may influence NMF, as weightlifters’ triceps have a higher NMF than bodybuilders’ (but again, as with the data on muscle fiber specific tension, you can’t draw causal inferences from cross-sectional research – all this does is give us a hint).
Looking at the level of the whole muscle, we’re starting to see some factors that clearly help explain our two conundrums. The little guy may outlift the bigger guy because of more favorable muscular attachment points (longer muscle moment arms), more beneficial muscle architecture, or higher NMF.
Furthermore, you’re able to gain more strength than muscle mass, in part, because muscle moment arms tend to get longer as muscles grow (which has a force multiplying effect), and because NMF increases as you train, meaning you can produce more muscular force per unit of muscle mass.
Anthropometry: Effects on Joint-Level Demands for Strength Expression
So far, we’ve looked at the factors that affect how much force a muscle can produce (both dependent on size and architecture, and independent of size and architecture) and how effectively that force can be translated into joint moments (via variation in and changes in muscle moment arms).
In addition to those factors, how you’re built – your anthropometry – can affect the amount of weight you can lift independent of your ability to produce large joint moments.
Let’s use the squat as an example. The net summed knee and hip extension moment required to lift a weight can be approximated with this equation: Required net knee + hip extensor moment = load x femur length x cos(femur angle).
In other words, at a given depth and with a given load, the total lower-body demands in the squat are determined by the length of your femur. If two people have muscles that contract with the same amount of force and identical muscle attachments points, but Person A’s femurs are 20% longer, Person B should squat about 20% more.
Now, in the real world it doesn’t tend to make THAT big of a difference, because muscle attachment points may scale with bone length (so the person with a 20% longer femur may also be expected to have muscle moment arms that are 20% longer, effectively negating the extra femur length) on average. It’s not entirely clear that such is the case, since powerlifters with a larger crural index (a longer shin relative to the length of their femur) tend to squat and total more than powerlifters with a smaller crural index, but at the very least, the gap in performance isn’t as large as would be expected solely based on anthropometry.
Independent of everything else, body segment lengths can make a large impact on performance, but it’s less clear how big of a difference they make in the real world since segment lengths and muscle moment arms may go hand in hand on average. However, anthropometry could easily play a part in explaining our first conundrum (a little dude outlifting a big dude) if the little dude had favorable segment lengths (i.e. short femurs for the squat or short arms for the bench) and the jacked dude had less favorable segment lengths, but both had similar muscle moment arms. On the other hand, your anthropometry doesn’t change with training, so anthropometric factors don’t do much to explain the disproportionate gain in strength seen with training.
Skill Learning
It’s hard to quantify how large of an effect skill learning has on strength gains. We can get an idea of the magnitude of its effect by looking at the research on training specificity. Chris Beardsley has done a great job summing up the research on training specificity (I’d highly recommend this article). In short, strength gains are specific to the muscle action (concentric vs. eccentric vs. isometric), velocity of movement, range of motion, external load type (constant vs. variable loading), and degree of stability. Muscle architecture changes may play a role in some of those dimensions (muscle action and range of motion especially), but most of the differences can likely be attributed to your nervous system learning how to optimally produce force based on the specific demands of a movement.
Here’s one very simple example:
This study by Mitchell is often held up as a prime example illustrating the principle of specificity. It examined the effects of heavy (80% 1rm) vs. light (30% 1rm) training, using unilateral knee extensions.
One condition was 3 sets to failure with 30%, one condition was 1 set to failure with 80%, and the last condition was 3 sets to failure with 80%.
Here’s what tends to be reported: one-rep max increased more in the two 80% conditions than the 30% condition, leading to the unsurprising conclusion that heavier loads tend to cause larger strength gains than lighter loads. Additionally, the number of reps that could be completed at 30% of 1rm increased the most in the group training with 30%, showing that strength endurance tends to increase more with lighter training.
Here’s what generally isn’t reported: maximum voluntary isometric contraction strength, maximum power output, and rate of force development increased the same amount in all three conditions. When strength was tested via one rep max, the 80% conditions produced better results, likely because doing full eccentric and concentric reps with 80% is more similar to a 1rm test than performing the same contractions with 30%. However, when producing the most isometric force possible, or when producing the most power possible (two other measures of strength that weren’t specifically trained in this study), load didn’t seem to have an impact, likely because none of the training conditions were all that similar to an MVC test or a maximum power test.
In other words, even with something as simple as a unilateral knee extension, we’re likely seeing the effects of skill learning. 1rm increased more in the 80% 1rm training conditions, even though “true” maximum force output (assessed by maximal isometric contraction which allows people to exert almost all of the force they’re capable of) increased by the same amount in all three groups.
The impact of skill learning would likely be much larger in a more complex movement like a squat, bench press, deadlift, clean and jerk, snatch, etc. For example, I know my 1rm squat has increased roughly 5-fold since I started training, but the weight I can use for DB triceps extensions (which I’ve also trained consistently as an accessory lift for bench press) has only roughly doubled.
Skill acquisition can help shed some light on both of our conundrums. If gaining skill can help you lift more weight, that helps explain why you have the capability to gain more strength than muscle mass across a training career. Furthermore, there’s doubtlessly variability in how thoroughly you can master an exercise, which helps explain how a more skilled smaller person could outlift a less skilled larger person.
The Relationship Between Gains in Strength and Gains in Size
At this point, it should be clear that there is a multitude of factors that influence strength apart from sheer muscle size. Muscle cross-sectional area generally explains around half the variability you see in strength, but plenty of other factors can play a role, from muscle fiber specific tension to muscle moment arms to muscle architecture to NMF to skill learning. Since NMF improves with training, muscle moment arms tend to get longer with training, and skill acquisition can play a major role in strength development (especially for more complex movements, though skill learning can impact something as simple as unilateral knee extensions), gaining more strength than muscle mass over a training career should make a lot more sense.
Additionally, there’s a huge amount of variation in how some of those factors respond to training, specifically NMF and skill acquisition. Plus, muscle moment arms vary person to person and can affect strength output independent of muscle contractile force. Therefore, it should be clear why some people with less muscle can outlift people with more muscle.
Now let’s turn our attention to another issue: Since muscle mass isn’t the only factor influencing strength, how much do gains in muscle mass influence gains in strength?
Surprisingly, there aren’t many studies that examine this relationship.
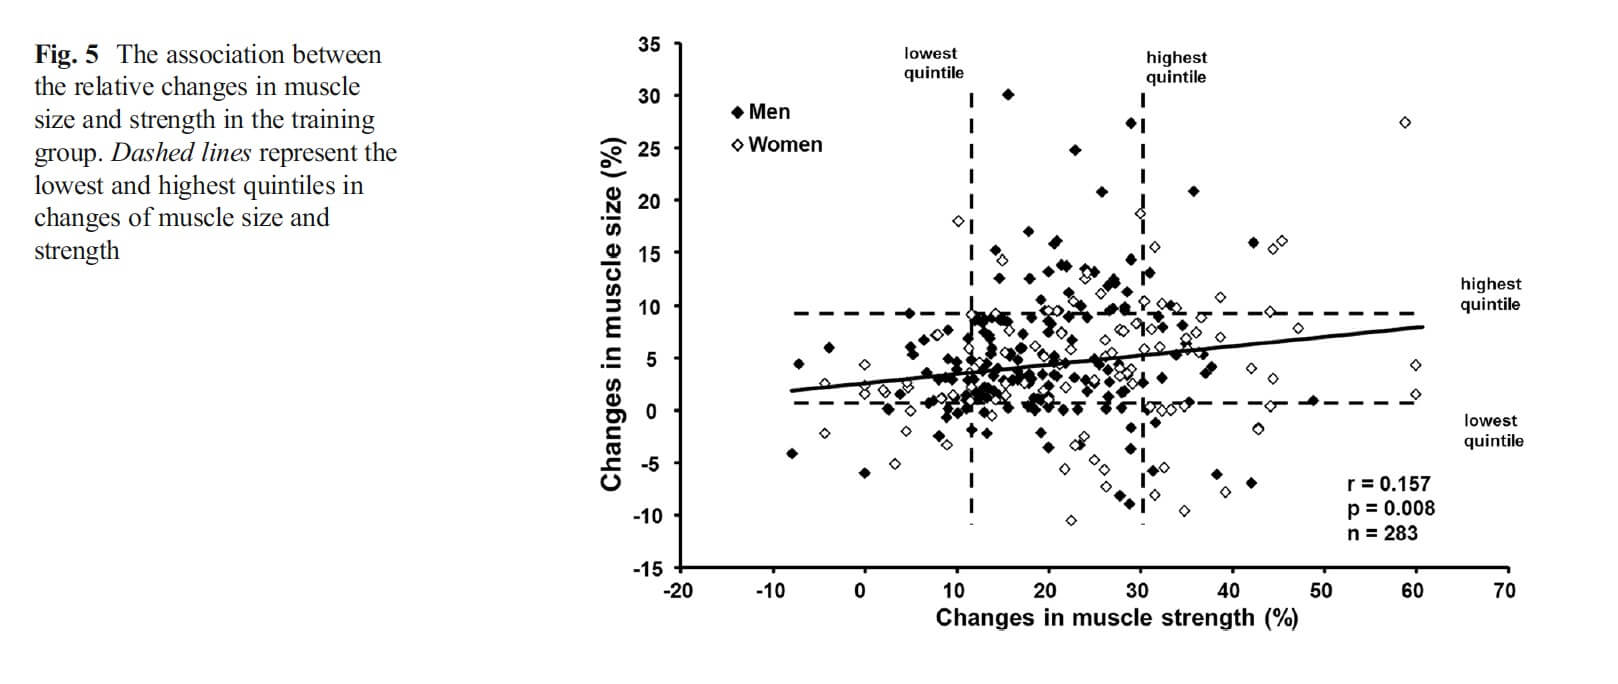
The first, a recent study by Ahtiainen, found that there was essentially no correlation whatsoever between gains in quadriceps size and gains in leg press strength after a 5-6 month training period in a heterogeneous, untrained population (males and females, aged 19-78 years old). The correlation coefficient was only r = 0.157, meaning that only about 2.5% of the variation in strength gains could be explained by gains in muscle mass!
Another 9-week study by Erskine used a homogeneous, untrained population (18-39 year old males) and found that the relationship between gains in muscle and gains in strength depended on how strength and muscle mass were measured.
For example, the correlation between physiological cross-sectional area and muscle contractile force was only r=0.14, and the correlation between maximum knee extension torque and quadriceps muscle volume was only r=0.15. Both of these very weak correlations mean that changes in size only explained about 2% of the variation in strength gains.
However, the correlation between increases in maximum knee extension torque and increases in ACSA was r=0.48, meaning that about 23% of the increase in strength could be explained by an increase in muscle size.
It’s also worth mentioning that the factor that correlated most strongly with strength gains was increases in NMF: r=0.79, meaning that increases in NMF explained around 62.4% of the variation in strength gains.
In another Erskine study, initially untrained participants trained their elbow flexors (AKA they did curls) for 3 weeks to facilitate any early neurological adaptations, detrained for 6 weeks to lose any muscle they may have gained in the 3-week lead-in period, and then trained their elbow flexors again for 12 weeks.
Gains in muscle volume during the 12-week training period correlated with gains in strength: r=0.527 for gains in isometric maximum voluntary force, and r=0.482 for increases in biceps curl 1rm. This means that with the very earliest neurological gains (hopefully) accounted for, changes in muscle volume explained about 23-27% of the variation in strength gains.
Thus far, there are only two studies on trained lifters.
The first by Baker involved lifters with at least 6 months of training experience, who needed to at least have a bodyweight bench press.
Over the course of the 12-week study, the correlation between gains in lean body mass (a pretty good proxy for muscle mass, assuming no big shifts in muscle glycogen levels or hydration status) and gains in squat and bench strength were r=0.59 and r=0.68 respectively, and “a multiple correlation between changes in squat and bench press strength and changes in LBM revealed an even stronger relationship (r=0.81, r2=0.65), suggesting that changes in LBM are the principal factor for increasing maximal strength in athletes of this level.” In other words, gains in lean body mass explained about 35% of the variation in squat gains, 46% of the variation in bench gains, and 65% of the variation in gains in both lifts combined.
The second by Appleby found that over a 2-year period, gains in lean mass index (LBM divided by the square of height – like BMI, but just with lean mass instead of total body mass) correlated strongly with gains in squat strength (r=0.692-0.880), but not with gains in bench press strength (r=0.244-0.314), meaning that gains in LMI explained about 48-77% of the gains in squat strength, but only about 6-10% of the variation in bench press strength.
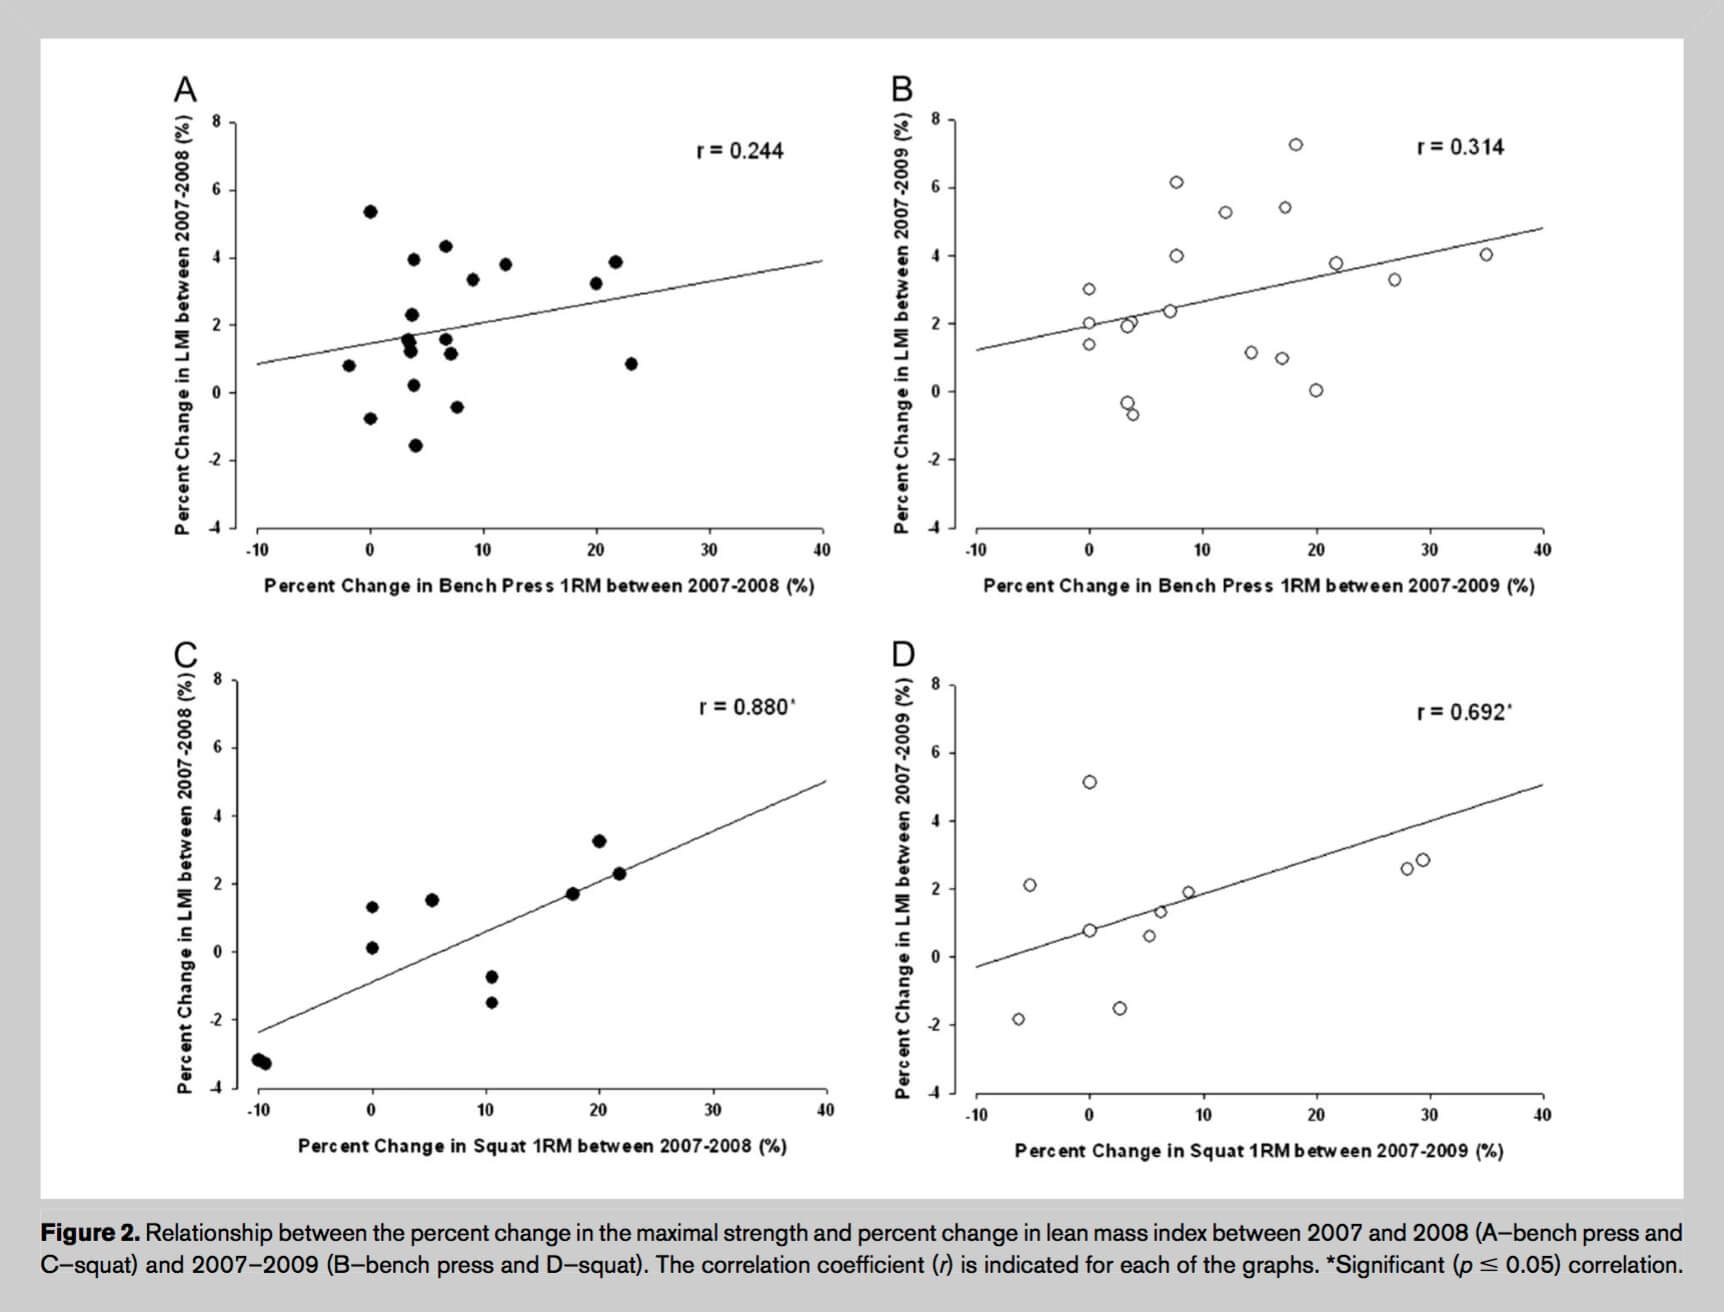
Perhaps the strong relationship between changes in LMI and changes in squat 1rm versus the lack of relationship between changes LMI and changes in bench press strength should be expected, since the squat tests the strength of a much larger proportion of your muscle mass. However, this finding contrasts somewhat with Baker, who found that changes in LBM predicted gains in bench press strength somewhat more than changes in squat strength.
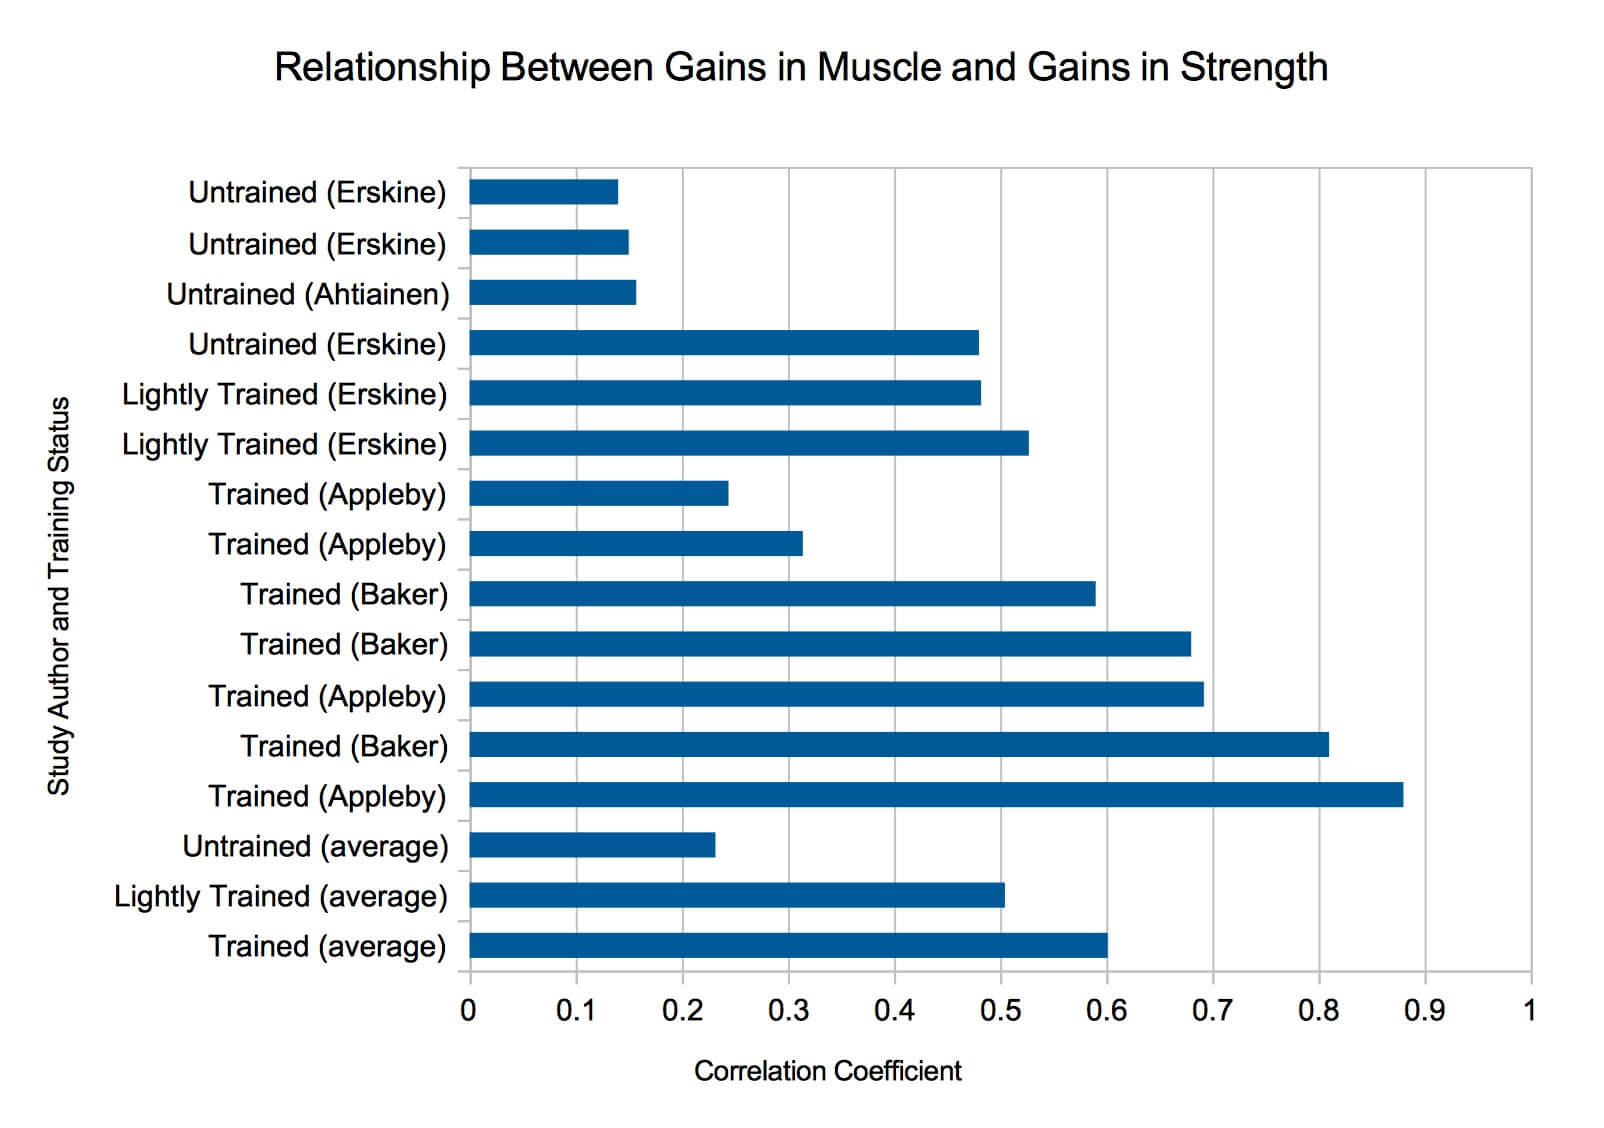
Taken together, a clear trend emerges from these studies: In untrained populations, the relationship between gains in muscle and gains in strength is very weak and tenuous, but as training status increases, the relationship strengthens. After just a 3-week habituation period, the correlation increased to r~0.5, and the average correlation seen in Bakers’ and Appleby’s studies on trained athletes was stronger yet.
So the next logical question becomes: Are there any reasons to expect the relationship to strengthen over time?
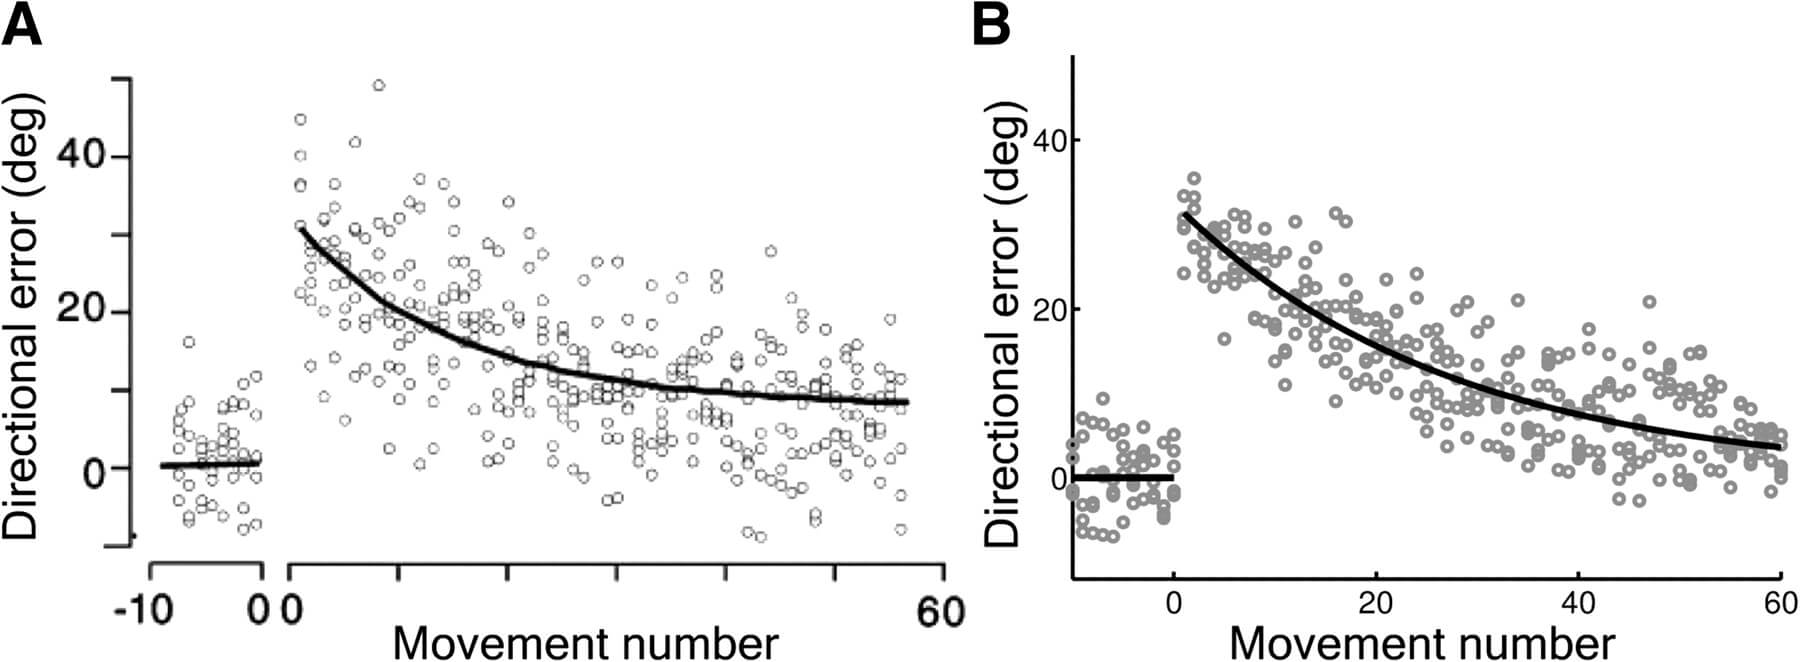
As a matter of fact, yes. Especially early in a training program, gains in strength far outstrip gains in muscle mass. In fact, many studies show little to no increases in muscle mass within the first 4-6 weeks of training (and studies that do show earlier hypertrophy may be confounded by swelling and inflammation in the muscle), whereas strength gains start from day 1. The two most likely explanations are early gains in motor skill (which accrue very rapidly within the first few training session) and early changes in NMF. Remember, in this study, early increases in NMF correlated very strongly with changes in strength, accounting for 60-65% of the variability in strength gains.
Data from Narici illustrate this beautifully.
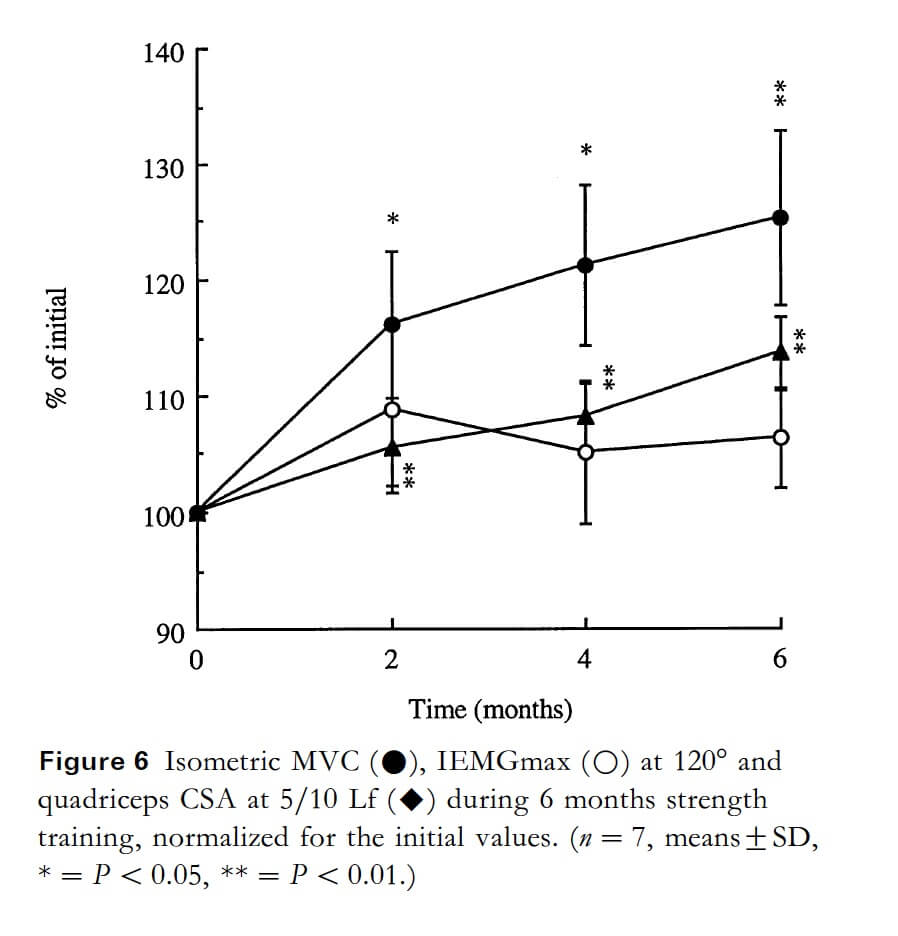
As you can see, after 2 months of training, strength increased by about 15%, while muscle mass only increased by about 5%. Since the strength measure here was an isometric contraction, the disproportionate increase in strength must be due to an increase in NMF (remember, people can “access” essentially all of their strength for an MVC even when untrained, meaning skill learning isn’t playing a meaningful role here). However, after the second month, strength and muscle mass go hand in hand, both increasing by about 5% per month.
So:
- It seems that most of the changes in NMF take place within the first two months of training.
- Changes in NMF are the strongest predictor of early changes in strength.
- There’s considerable variability in NMF changes (17±11%), meaning you’d expect strength gains to show roughly the same degree of variability independent of changes in muscle mass.
- When you account for differences in skill acquisition and the role they can play in strength development for more complex movements, you’d expect even more variability in strength gains independent of hypertrophy.
Thus, the lack of correlation between hypertrophy and strength gains in untrained participants shouldn’t be surprising.
By the same token, it also makes sense that the relationship would strengthen over time after the early, rapid, and variable motor skill acquisition and NMF increases were accomplished. Once two major sources of variability are removed (or, at the very least, once their contribution to strength gains gets smaller), you’d expect gains in muscle to be more predictive of gains in strength.
Right now, the best data we have to examine the relationship between strength and muscle mass comes from a study on elite powerlifters, and one on elite weightlifters.
In everyday Joes and Janes, all of this variability we’ve discussed so far will rear its head: variability in NMF, variability in muscle moment arms, variability in propensity to master motor skills, etc. Elite athletes aren’t all identical by any means, but it’s safe to assume that they were dealt pretty good hands for most of those confounding factors. There’s still variability in the factors that can influence strength independent of muscle mass, but there’s almost certainly much less variability. This relative homogeneity – everyone having good genetic draws for all or most of the factors that contribute to strength – gives us the best look we’re going to get into the relationship between muscle mass and strength, controlling for all of those other factors as well as is possible in a “real world” setting.
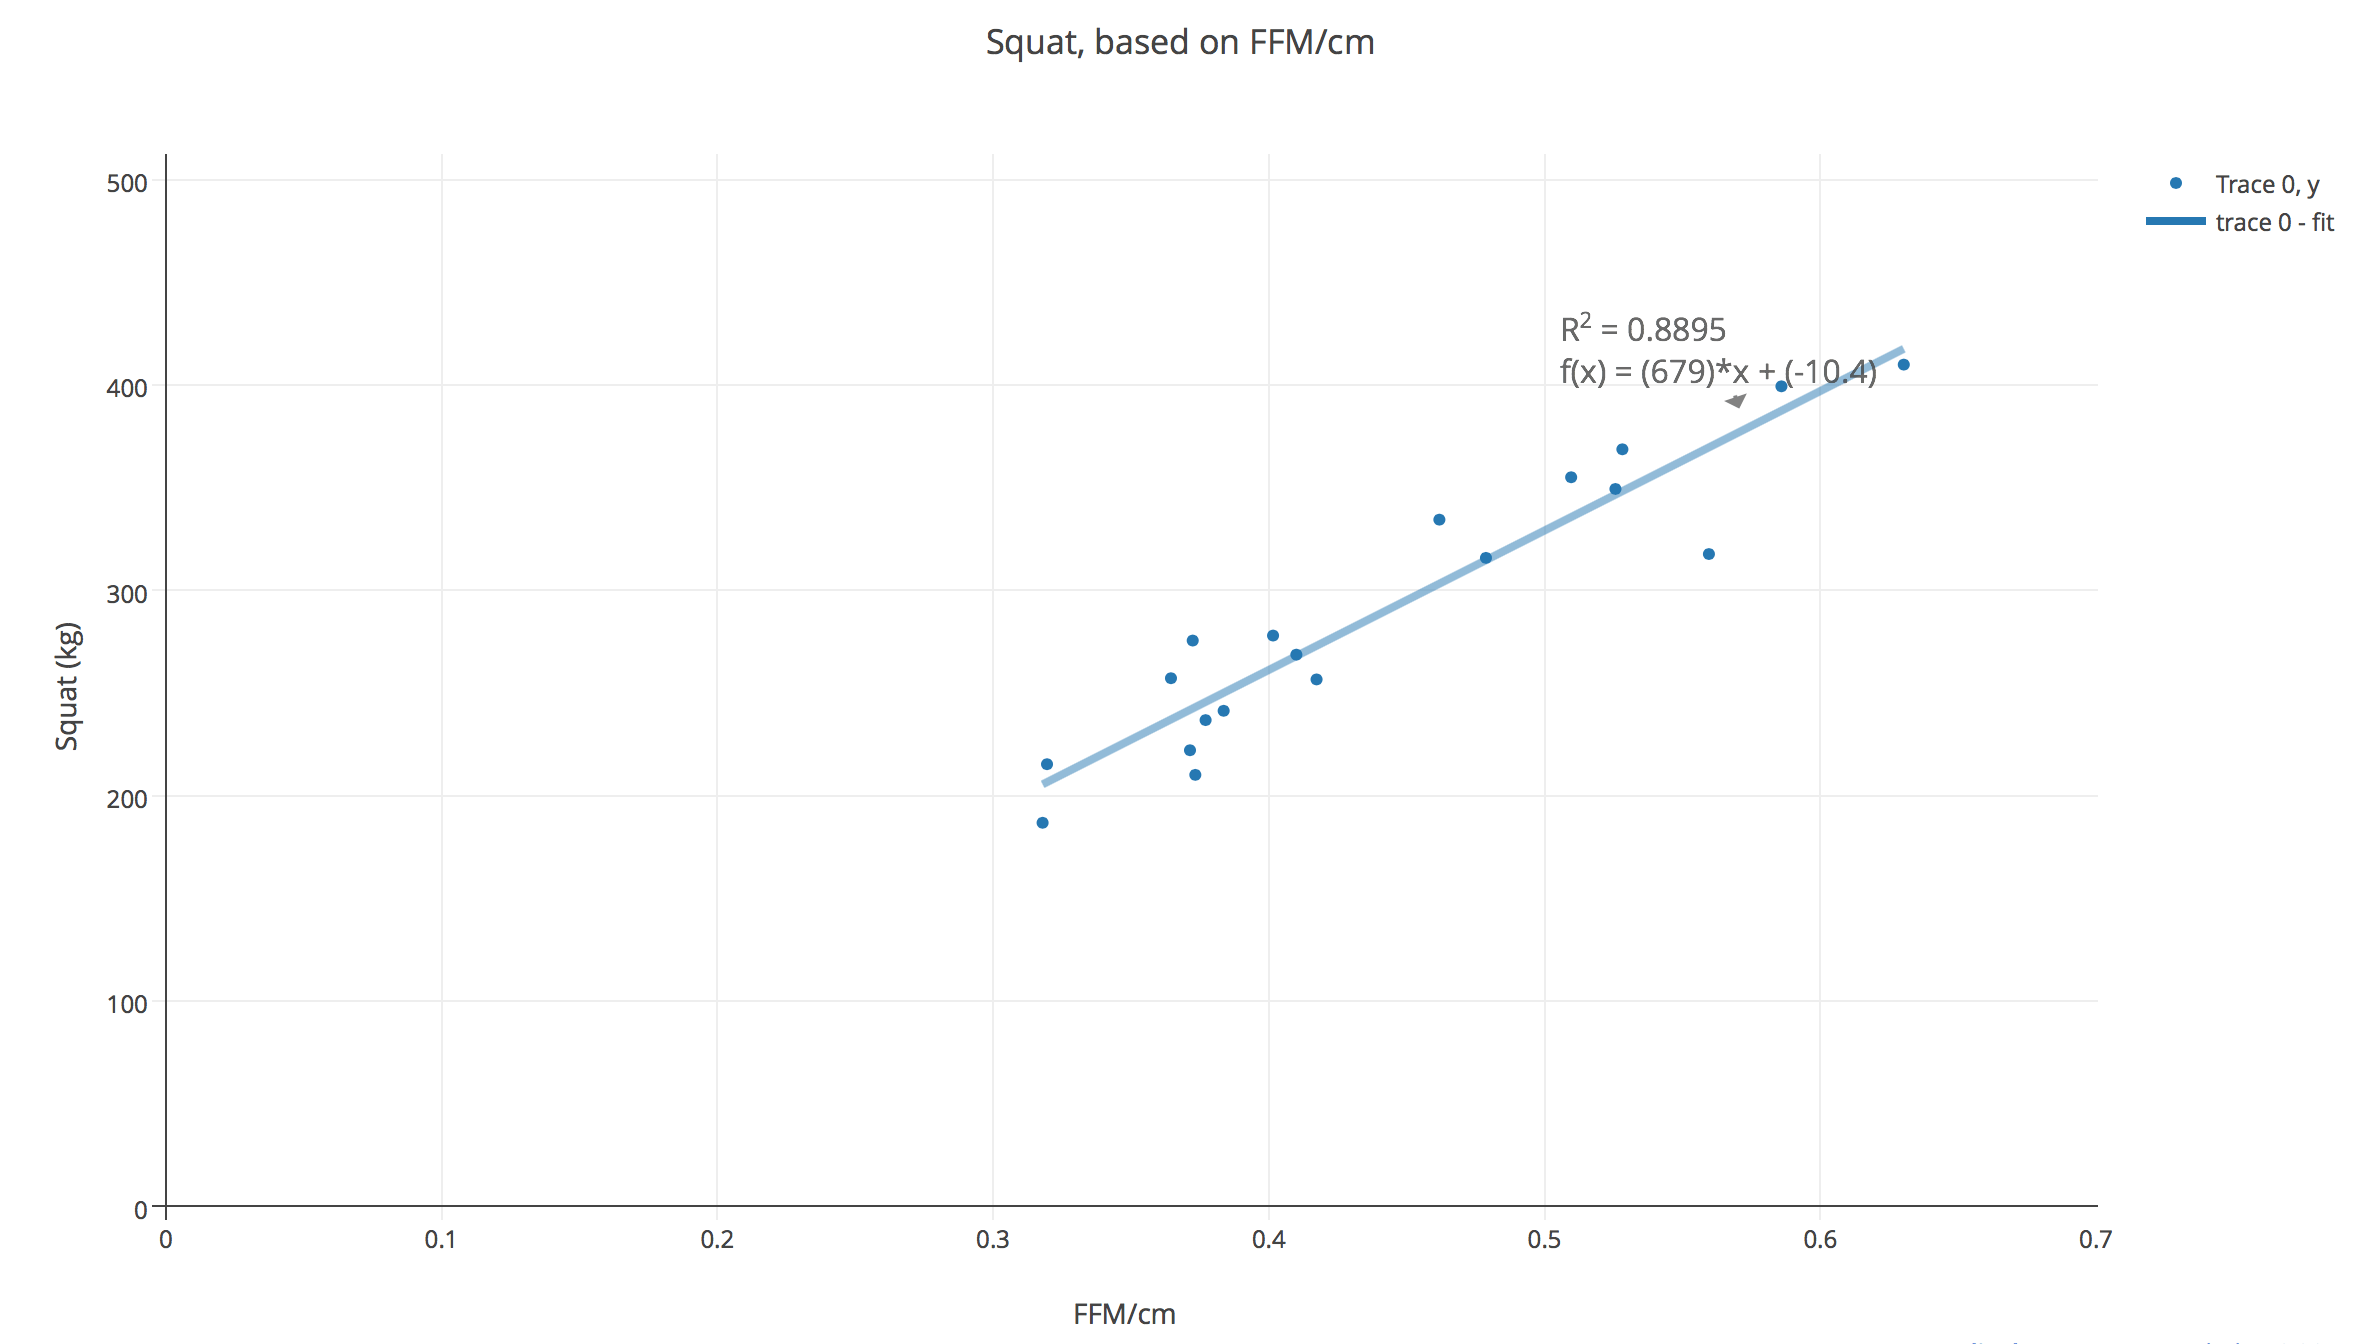
Brechue and Abe found that in powerlifters, the correlation between strength in one of the powerlifts and the thickness of the prime movers for the lift (i.e squat strength and quad thickness or bench press and triceps thickness) was mostly r=0.8-0.95. Furthermore, the correlation between strength in the three lifts and FFM or FFM/cm was r=0.86-0.95. So, muscle thicknesses of prime movers explain about 65%-90% of the variation in strength, and FFM or FFM/cm explain about 75-90% of the variation in strength. The relationship between squat strength and FFM/cm can be seen below.
Another study by Jones et al. in trained (but non-elite) lifters found an almost perfect relationship between FFM and conventional deadlift 1RM: r=0.965.
A similar study by Siahkouhian and Hedayatneja in young elite weightlifters found that the correlation between lean body mass and strength in the squat, front squat, snatch, and clean & jerk ranged from r=0.836-0.897, meaning that variation lean body mass explained about 70-80% of the variation in those lifts.
In both of these studies we can see that – in probably the most homogenous population we could hope for (i.e. the other factors that influence strength controlled for to the greatest degree possible) – LBM is very predictive of strength.
Similarly, as I discussed in this article, 2/3 power allometric scaling does a very good job of normalizing strength performances among elite competitors (check out the linked article if you need a refresher on allometric scaling). This is significant because 2/3 power allometric scaling is based on the assumption that strength can be predicted by muscle cross-sectional area. Cross-sectional area is a second order characteristic, and body mass is a third order characteristic (assuming similar tissue densities), hence the 2/3 power. In simple terms, if every aspect of your body doubled in size (height, width, and breadth), you’d expect your strength to increase 4-fold (22) to match a 4-fold increase in muscle CSA, and you’d expect your weight to increase 8-fold (23).
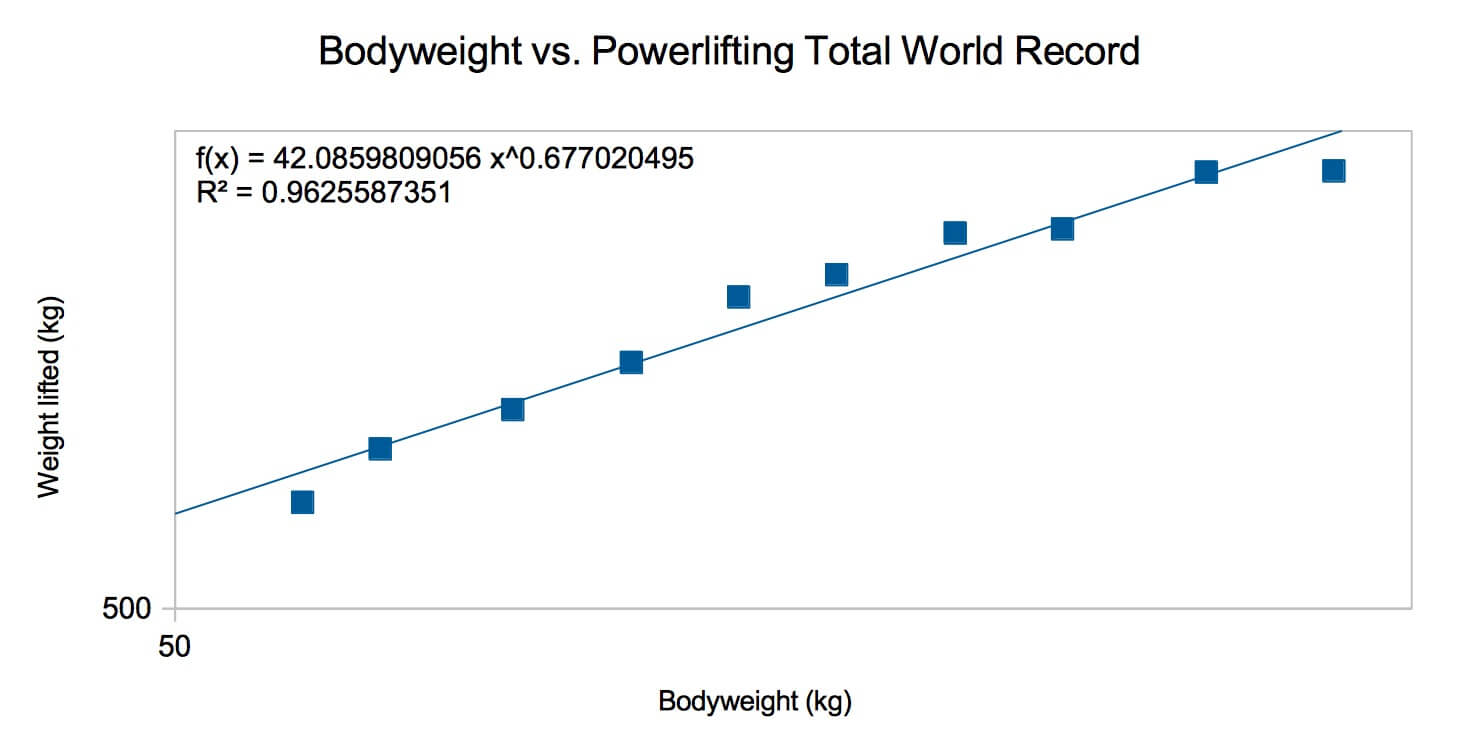
A 1956 paper by Lietzke found that when plotting weightlifting world records on a log/log graph (bodyweight vs. weight lifted), a linear trendline fit the data almost perfectly, and the slope of the resultant trendline was .6748 (almost identical to the slope of .667 you’d expect in theory). I checked the current powerlifting world records (raw, with knee wraps, not drug-tested) as well, and the resultant trendline had a slope of .677, with roughly 96% of the variation in weight lifted explained by size.
Since 2/3 power allometric scaling does work so well to normalize and predict strength at the elite levels, either:
a) Muscle size is also very predictive of strength in these populations (an assumption of the model).
b) A near-perfect relationship exists between body weight and strength when such scaling techniques are applied, but in spite of the fact that the relationship matches the one that would be predicted based on the changes in body mass and changes in muscle cross-sectional area that would come with increases in body size, some other unknown factors are what actually explain the relationship (that sound you hear is Occam’s Razor shattering into a million pieces).
c) The relationship is completely coincidental and spurious (which is also unlikely, since it explains 96% of the observed variation).
Now, just to temper this discussion of allometric scaling a bit, I also checked the log/log relationship for the current weightlifting world records, and the slope was only 0.55 – considerably different from the theoretical slope of .667 that would be predicted by the relationship between mass and muscle cross-sectional area. However, the different scaling coefficient may relate to the demands of modern weightlifting. Weightlifting in 1956 and powerlifting both had/have a greater reliance on force output than modern weightlifting (since the press was still a weightlifting event at the time), whereas modern weightlifting has a relatively greater reliance on power output.
It may be that the relationship between size and strength (force output) can be adequately explained by 2/3 power allometric scaling – which assumes that strength can be predicted by muscle CSA – but the relationship between size and power output requires a different scaling coefficient, indicating a weaker (or at least different) relationship between muscle size and power output. That would make sense for a variety of reasons, one of which is the lengthening of muscle moment arms with hypertrophy. Longer muscle moment arms are beneficial for force output, but detrimental for power output.
Now, there is one last caveat I want to address before wrapping up: In all of these studies, the training plans were either identical or very, very similar. In the studies addressing the correlation between hypertrophy and strength gains, all of the participants in each study were training with the same percentages of their 1rms, and in the studies on powerlifters and weightlifters, we can probably assume that they were mostly doing a lot of heavy training without all that much variation in training styles.
However, training style muddies the water. As I covered in this article, as long as training volume is roughly equated and you’re pushing your sets near failure, heavy, moderate-load, and light training all cause similar degrees of hypertrophy. Strength, however, is another story. Of the 13 studies included in the original analysis, 3 in the recent update, and 7 excluded due to methodological reasons, all except for 1 showed that training with heavier loads built more strength than training with lighter loads.
This would clearly decrease the correlation between gains in muscle mass and gains in strength in a general sense, and help explain how some smaller people who train specifically for powerlifting or weightlifting can out-lift more jacked individuals who train for bodybuilding, due to higher skill in the lifts, especially with 1rm loads (and potentially due to increases in NMF from heavier training as well).
On the other hand, the correlation between gains in muscle and gains in strength within an individual is likely stronger than the correlation between gains in muscle and gains in strength between individuals (which is what’s been studied to-date).
For example, let’s assume you have favorable muscle moment arms and favorable NMF, and you’re to the point that changes in NMF and increases in skill aren’t playing a major role in strength gains for you anymore. Your friend, on the other hand, has unfavorable muscle moment arms and unfavorable NMF, and his training status is basically the same as yours. If both of you gain the same amount of muscle on the same training program, you’re going to gain more strength than he is, because of those confounding factors. Add in 30 more “friends” with other mixes of muscle moment arms and NMF, and you’ll wind up with a correlation between gains in muscle and gains in strength, but the variation in muscle moment arms and NMF will keep that correlation from getting incredibly strong.
However, if your muscles get 5% bigger and you get 10% stronger in the process, then if your muscles got another 5% bigger on the same training program, in all likelihood your strength would increase by around 10% again. You are inherently less “noisy” than an entire population of people, so you should expect your own personal relationship between gains in muscle and gains in strength to be stronger than the relationship observed in a larger population.
Big Picture
Muscle mass certainly influences strength, but it’s also certainly not THE determinant of strength between individuals, and hypertrophy is not the only factor influencing strength gains. There’s massive variation between people in factors that directly influence strength, such as NMF and muscle moment arm lengths. Furthermore, with training, some people gain strength much faster than others, independent of hypertrophy, due to the variable changes in NMF and the variation in ability to learn and master exercises.
Over the course of a training career, you gain more strength than muscle mass because there are a multitude of factors that can contribute to strength increases on top of increases in muscle mass, so it’s only logical that your strength gains will outstrip your muscle gains.
Hypertrophy’s direct contribution to strength likely increases with training experience, as adaptations that occur very rapidly (such as skill acquisition and changes in NMF) play progressively smaller roles in strength gains. Since strength is highly specific, you’ll likely gain strength faster by training heavier versus training lighter, though you’ll likely build muscle at roughly the same rate regardless of training load (assuming volume is matched).
Hence, building muscle will probably make you stronger, but it will certainly increase your potential strength. A version of you with more muscle will have the potential to lift more than a version of you with less muscle, though you very well may be able to out-lift someone with way more muscle than you have, and you may still be put to shame by someone who’s way less muscular than you.
If your goal is to maximize your long-term strength gains, you should aim to build as much muscle as you can along the way.
In closing, I’d like to thank Andrew Vigotsky, Eric Helms, and Brandon Roberts for their contributions and feedback. This article was hugely improved by their input and suggestions. I’d also like to thank Jeremy Loenneke for bringing this topic to the forefront of discussion. Our views diverge pretty significantly, but his work has been immensely helpful in getting people (myself included) to realize that the relationship between hypertrophy and strength gains isn’t quite as strong as many assume.
Addendum, March 2017
A recent study by Loenneke et al. highlights one of the more technical points above. I suggested that although hypertrophy doesn’t explain all that much of the variation in strength gains between people, especially in untrained lifters (generally ~4% of the variation, with one or two studies in the ballpark of 20%), it likely explains much more of the variation within single individuals. People are different – they have different limb lengths, different muscle moment arms, nervous systems that respond in slightly different ways, etc. – and all of those differences necessarily weaken the relationship between muscle growth and strength gains when comparing different people. Thanks again to Andrew Vigotsky for pointing this issue out.
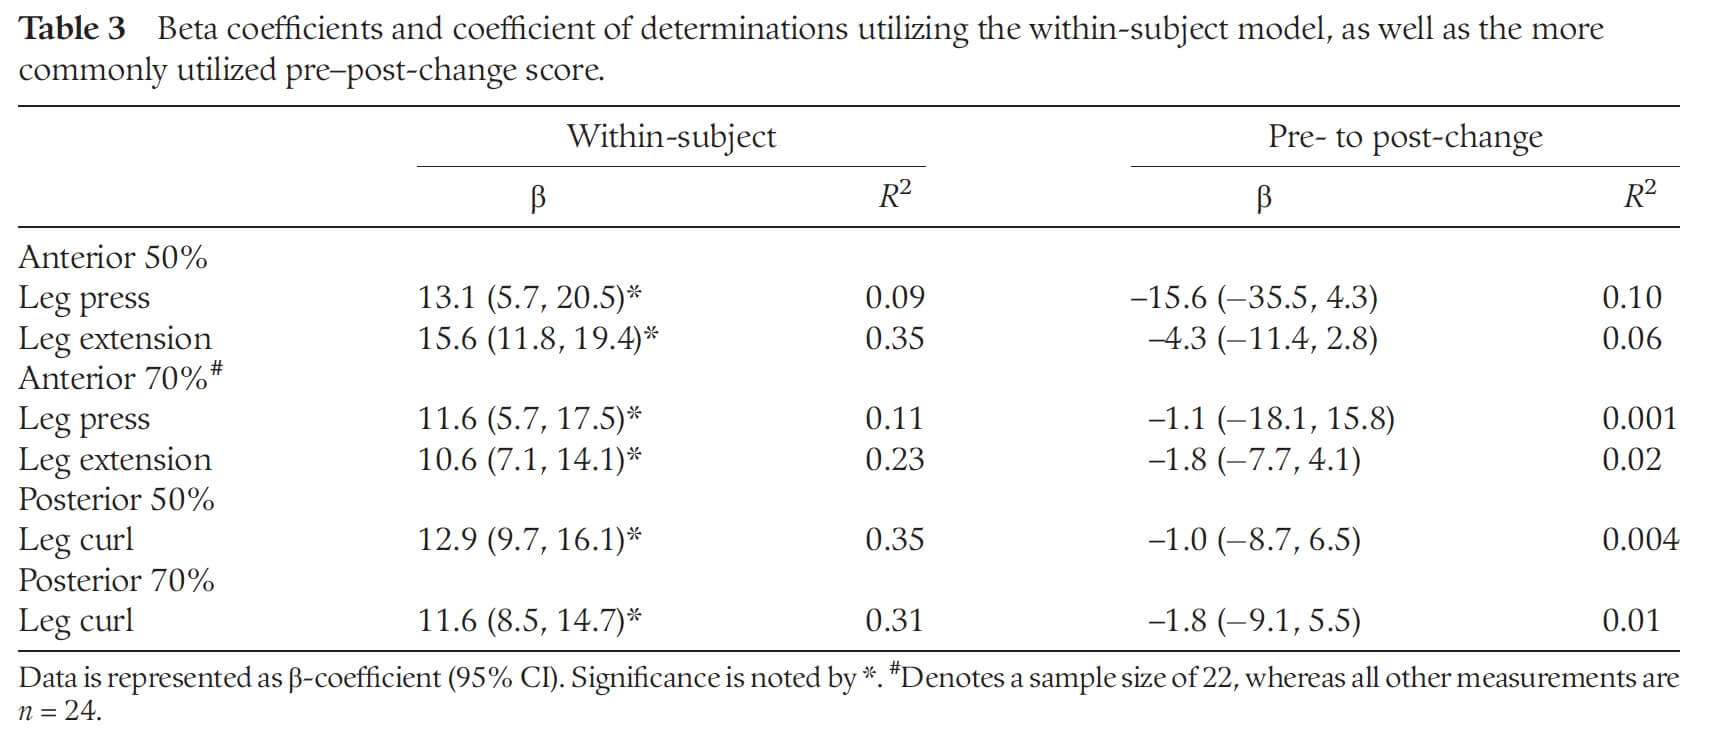
In this study on untrained women, hypertrophy only explained 0.4-10% of the variation in strength gains between subjects, which is in line with other research. However, a within-subjects model showed that hypertrophy actually explained between 9-35% of the strength gains on an individual level, which is considerably higher than previous studies on untrained lifters looking only at between subject relationships.
This would seem to suggest that the relationship between hypertrophy and strength is likely stronger than the evidence in this article would suggest, but we’ll need more studies using within-subject models to know for sure.
Addendum, May 2017
A new study relevant to this topic was published in the past month by Balshaw and colleagues.
In a group of untrained lifters, changes increases in quadriceps muscle volume were moderately correlated (r=0.461) with increases in maximal voluntary knee extension torque over 12 weeks of training, meaning increases in muscle size explained about 21% of the variability in strength increases. In a multiple regression analysis, changes in muscle size only independently explained about 18.7% of the variability in strength gains (as changes in quad volume were loosely correlated with other factors included in the model).
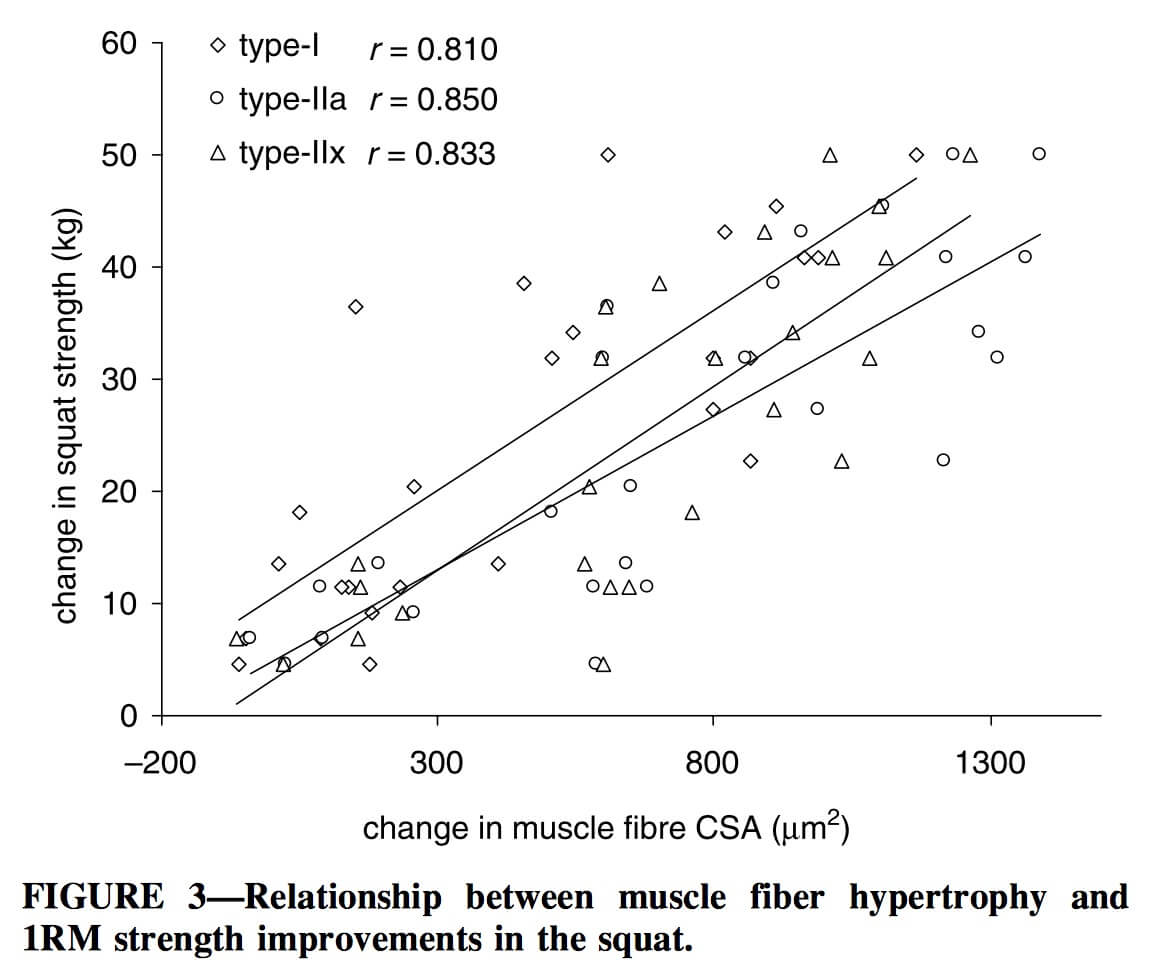
My friend Adam Tzur also hooked me up with a 2007 study by Cribb and colleagues that I missed when gathering sources for this article. The participants were men with at least 6 months of training experience: the average 1rm squat at the start of the study was about 120kg (about 265lbs), so they clearly had a bit of experience squatting, but weren’t incredibly well-trained.
This study looked at the relationship between changes in squat strength and changes in muscle fiber cross-sectional area. Hypertrophy of all three primary fiber types correlated strongly with changes in 1rm squat strength (r=0.81-0.85), with fiber growth explaining 65-72% of the variability in strength increases.
These two studies support the basic conclusion of the rest of this article. There’s a relatively weak relationship between hypertrophy and strength gains in newer lifters, but once someone has a bit of training experience, hypertrophy becomes very important for strength gains and the relationship strengthens considerably.
Addendum, August 2017
A new study (reviewed in the September issue of MASS, by the way) provides an interesting look at this issue. The subjects were untrained, and their strength was assessed using the bench press. However, they didn’t actually train the bench press throughout the course of the study. In this way, the researchers (seemingly inadvertently) controlled for the potential of divergent neural/motor learning effects – the majority of the strength gains in the bench press were likely due to increases in muscle mass and general strength of the musculature involved instead of being influenced by simple improvements in technique, coordination, neural firing patterns, etc.
They found that gains in lean body mass correlated strongly (r=0.80-0.81) with increases in bench press 1RM.
This study provides even more evidence for two of the main contentions of this article:
- Gaining muscle increases one’s potential to gain strength
- The low correlations between gains in muscle/LBM and gains in strength seen in previous studies on untrained people are likely due to the fact that non-muscular factors are the largest drivers of strength increases early on in the training process. In this study, where those neural effects likely played a much smaller role, there was a very strong relationship between gains in LBM and gains in strength, even in new lifters.
Addendum, May 2018
A recent paper on untrained subjects found that, in the first 10 weeks of training, changes in quad ACSA explain 13-18% of the variance in strength gains (changes in knee extension torque). Another recent paper found a moderate between-group difference in strength gains (biceps curl 1RM); however, when covarying for the change in biceps cross-sectional area, the effect size dropped to (effectively) zero, suggesting that differences in hypertrophy almost completely accounted for the differences in strength gains.
Addendum, July 2018
A recent paper by Vigotsky et al. helps further flesh out some of the more technical points in this article. In other research, there seemed to be virtually no relationship between hypertrophy and strength gains in untrained subjects using standard between-subjects Pearson correlations. However, such correlations can’t account for differences between subjects (muscle moment arms, normalized muscle force, rates of motor learning, etc.). Thus, there may still be strong correlations within subjects, even if those correlations aren’t apparent on a group level. This paper demonstrated that by comparing simple Pearson correlations to ANCOVAs (which look at within-subject correlations, allowing for random slopes but NOT random intercepts) and hierarchical linear models (HLMs; which look at within-subject correlations, allowing for random interceps and random slopes). Hierarchical linear models account for the most between-subject variation, making them the most appropriate statistical test.
The correlations between hypertrophy and strength gains were trivial to small (0-0.19) when using Pearson correlations (in line with prior research), but were small to moderate (0.27-0.49) with HLMs. Thus, even when accounting for individual variation, hypertrophy is far from being perfectly predictive of strength gains in untrained subjects, but accounting for individual variation reveals a much stronger relationship than had previously been reported.
Addendum, October 2018
I’d like to clarify one point in this article. Based on the fact that strength increases disproportionately more than muscle mass after strength training, some people have come away with the impression that hypertrophy isn’t all that important for strength gains. Sure, hypertrophy may help, but its benefits will be massively overshadowed by other adaptations.
I don’t think that’s the correct way to look at it.
Neural adaptations work by increasing the recruitment, force, and coordination of the muscle tissue. Increases in normalized muscle force due to connective tissue adaptations increase muscle force per unit of cross-sectional area. The non-hypertrophy-related adaptations increase strength because they make your muscles work better, but muscle itself – the actual contractile tissue – is ultimately the stuff producing the force.
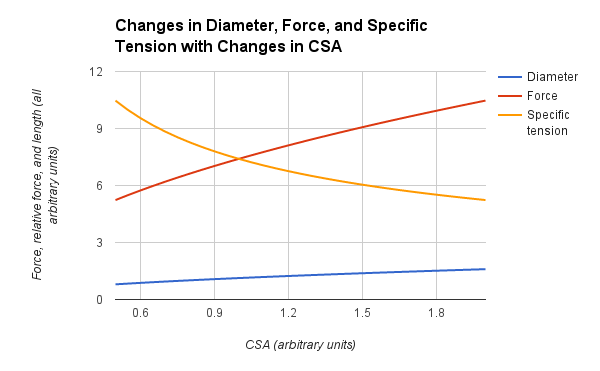
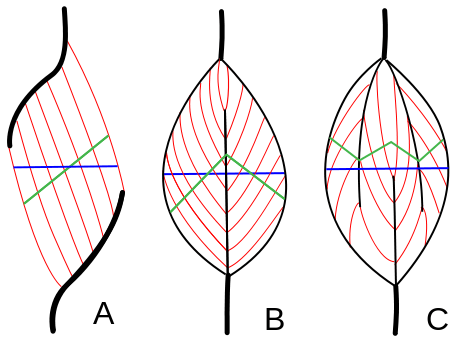
So, here’s a useful conceptual model:
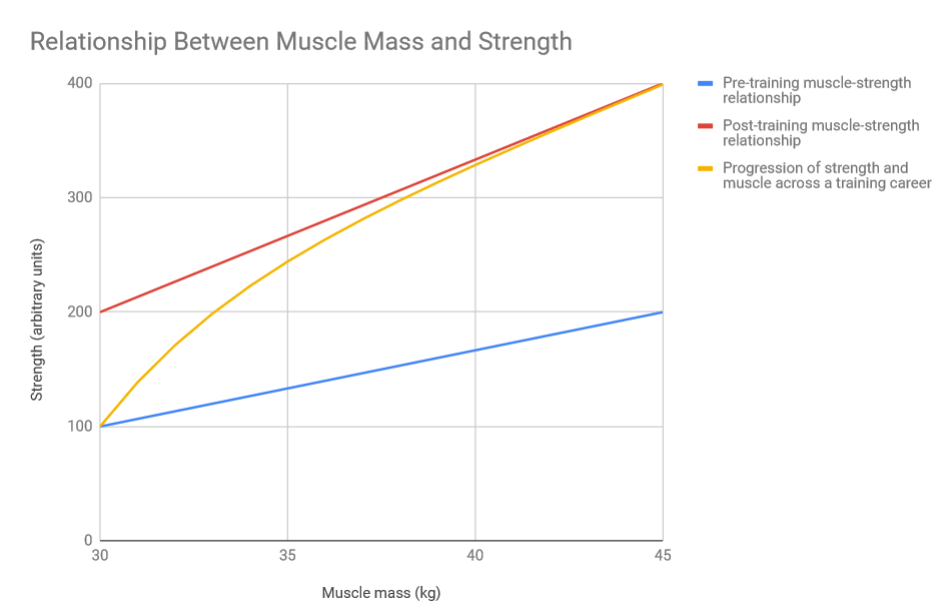
The blue line on the bottom represents the relationship between muscle mass and strength pre-training. As muscle mass increases, strength increases, but not by much. The red line on the top represents the relationship between muscle mass and strength after training – each unit of muscle mass generates twice as much strength output. The yellow line represents strength progress across a training career; it closes the space between the blue line (untrained, with each unit of muscle not generating much strength) and the red line (well-trained, with each unit of muscle generating substantially more strength) as non-hypertrophic strength adaptations accrue.
In this model, you could theoretically double your strength without any hypertrophy (jumping straight from the red line to the blue line without moving along the x-axis). At one-half of maximal hypertrophy, you could attain about 3/4 of your potential strength gains. But to maximize strength gains, you also need to maximize hypertrophy.
So, that’s the basic model I think we can draw from the information presented in this article. Ultimately, muscle tissue produces force, but the non-hypertrophic adaptations serve as force multipliers. It’s great to max out the force multiplier (and that force multiplier is larger for some people than others, and increases more in some people than others), but ultimately, strength will be constrained by the amount of contractile tissue you have. This is consistent with the observation that strength increases more than muscle mass (in the example above, strength increases 4-fold, while muscle mass only increases by 50%), but it should be clear that hypertrophy is still crucial for maximizing strength gains.