

After my article on training frequency for strength development last week, a lot of people asked whether higher training frequencies were also better for hypertrophy. I responded to all of them that frequency probably doesn’t matter as much for hypertrophy. After all, the two factors that seemed to be the most important for explaining the benefits of frequency for strength development (higher average rep velocity, and increased opportunity to practice motor patterns) don’t seem like they’d matter as much for hypertrophy. I linked a lot of people to Schoenfeld’s 2016 frequency meta-analysis, which found that frequencies of at least twice per week were better than a frequency of just once per week, with insufficient evidence to make conclusions about even higher frequencies. But then I thought more about it, and I realized that the whole reason I wrote my last article was the recent renaissance in the frequency research. So, I got back to the grind to analyze the effects of frequency on hypertrophy.
From the outset, I want to make my pre-existing bias clear. My assumption coming into this article was that, when training volume is equated, higher frequencies were probably beneficial for strength, but probably didn’t matter much for hypertrophy (past a frequency of twice or maybe thrice per week). This bias came from my observations of physical culture (a lot of successful strength training traditions preach higher frequencies, but lower frequencies seem to be the norm for lifters purely focused on hypertrophy), my non-quantitative assessment of the research (several individual studies found significant strength differences in favor of higher frequencies, but very few have found significant hypertrophy differences), and my lack of focus on this issue as a coach (I mostly just train people for strength; hypertrophy is a near-universal side effect, but it’s rarely my primary focus with my athletes).
In all of my other analyses up to this point (periodization, sex differences, and the effects of frequency on strength gains), the results have been more-or-less what I expected. This time, I was surprised.
Let’s dive in.
Technical Notes
Feel free to skip this section if you trust me to not fuck things up too badly.
I started by searching several databases to find all of the relevant studies, based on four criteria.
- The study needed to examine the effects of training frequency with volume and intensity per exercise or muscle group matched. The training intervention needed to last at least 6 weeks.
- The study needed to report changes in either direct measures of hypertrophy (i.e. muscle thicknesses or cross-sectional area), or indirect measures of hypertrophy (i.e. lean body mass or circumference measurements), and provide enough information to calculate weekly training volume (sets per week).
- The subjects needed to be healthy and non-elderly (since age could conceivably affect the relationship between frequency and hypertrophy, as older people recover slower from training).
- The study needed to be published in a peer-reviewed journal.
From each study, I pulled all relevant info, including length of the training period, number of subjects, pre- and post-training muscle size measures/estimates, and total sets performed per week. From there, I calculated effect sizes ((post – pre)/(pooled pre-training SD)) and percentage muscle growth ((post – pre)/pre) for each hypertrophy measure in each study. I also calculated percentage hypertrophy per week.
I analyzed these studies several different ways. I started with mixed-effects meta-analyses of effect sizes with frequency as a binary term (i.e. higher frequency vs. lower frequency), including all measures from all studies, just direct measures of hypertrophy, and just indirect measures of hypertrophy. I also calculated the pooled weekly percent hypertrophy and difference between groups for all exercises in all studies as a more easily interpretable meta-analysis, since effect sizes can sometimes seem somewhat abstract. I weighted the percentage-based analyses by the number of subjects in the study, with adjustments for the number of analyses in each study. For example, if a study had 5% of the total subjects in an analysis, and only one measure of hypertrophy, that single measure of hypertrophy would receive a weight of 5%. If, on the other hand, a study had 5% of the total subjects in an analysis, but used five measures of hypertrophy, each of those measures would receive a weight of 1% (so that the total weight of the study would remain 5%).
I made two tables for further analysis: one table of the weekly percentage hypertrophy for each frequency in all studies, and one table of the difference in weekly percentage hypertrophy for each frequency. In this second table, for example, a frequency of three times per week was occasionally the high frequency condition, and occasionally the low frequency condition; this allows for comparisons between a given frequency and all other frequencies (both higher and lower) to see if there’s a frequency “sweet spot” or a range of frequencies that tends to perform best.
As a sub-analysis, I analyzed studies comparing frequencies of once or twice per week to frequencies of 3+ times per week, and studies comparing frequencies of 1-3x per week to 4+ times per week using weekly percent hypertrophy. As further sub-analyses, I analyzed frequency as a binary term using percentage weekly hypertrophy in studies on trained lifters, studies on untrained lifters, estimates of upper body hypertrophy, estimates of lower body hypertrophy, direct measures of hypertrophy, indirect measures of hypertrophy, studies with a low training volume (<10 weekly sets for a given muscle group, or <60 sets per week total), and studies with a high training volume.
Results
Thirteen studies with a total of 305 subjects met the inclusion criteria, allowing for 40 comparisons. The average study was 8.3 weeks long (range: 6-12 weeks) with 10.9 subjects per training group (range: 8-15). Four studies used untrained subjects, while nine used subjects with at least some prior training experience.
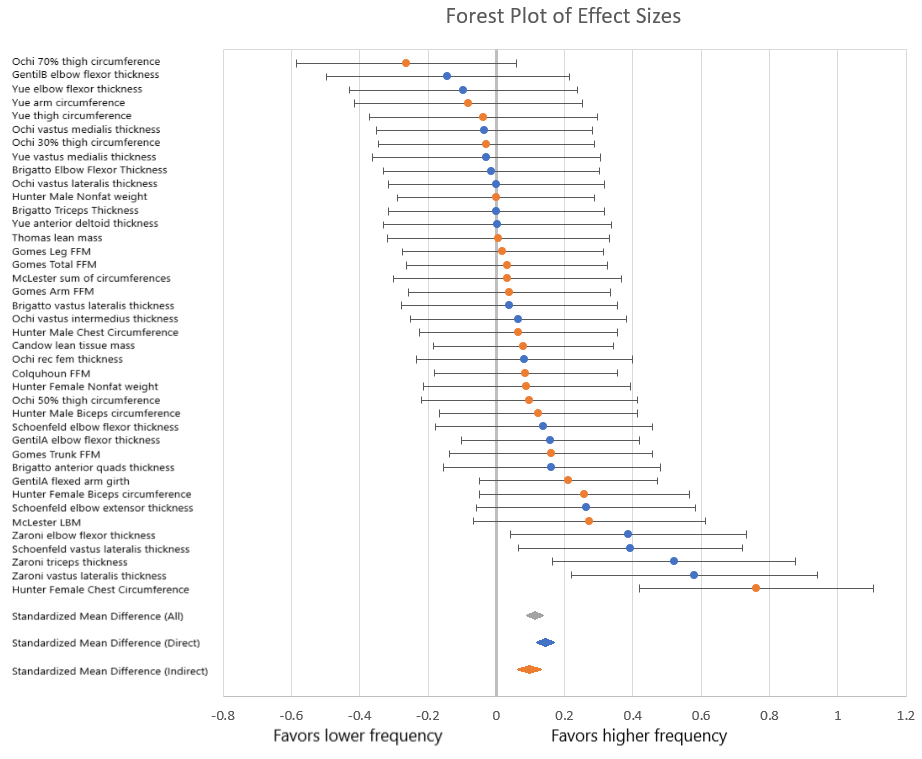
The random effects meta-analysis of all hypertrophy measures found that higher training frequencies were associated with significantly more hypertrophy (p<0.0001), though the overall effect was trivial (d=0.113; CI=0.07-0.16). When analyzing only direct or indirect measures of hypertrophy, the story is very similar (d=0.143; CI=0.09-0.19; p<0.0001 for direct, and d=0.097; CI=0.03-0.16; p=0.0098 for indirect).
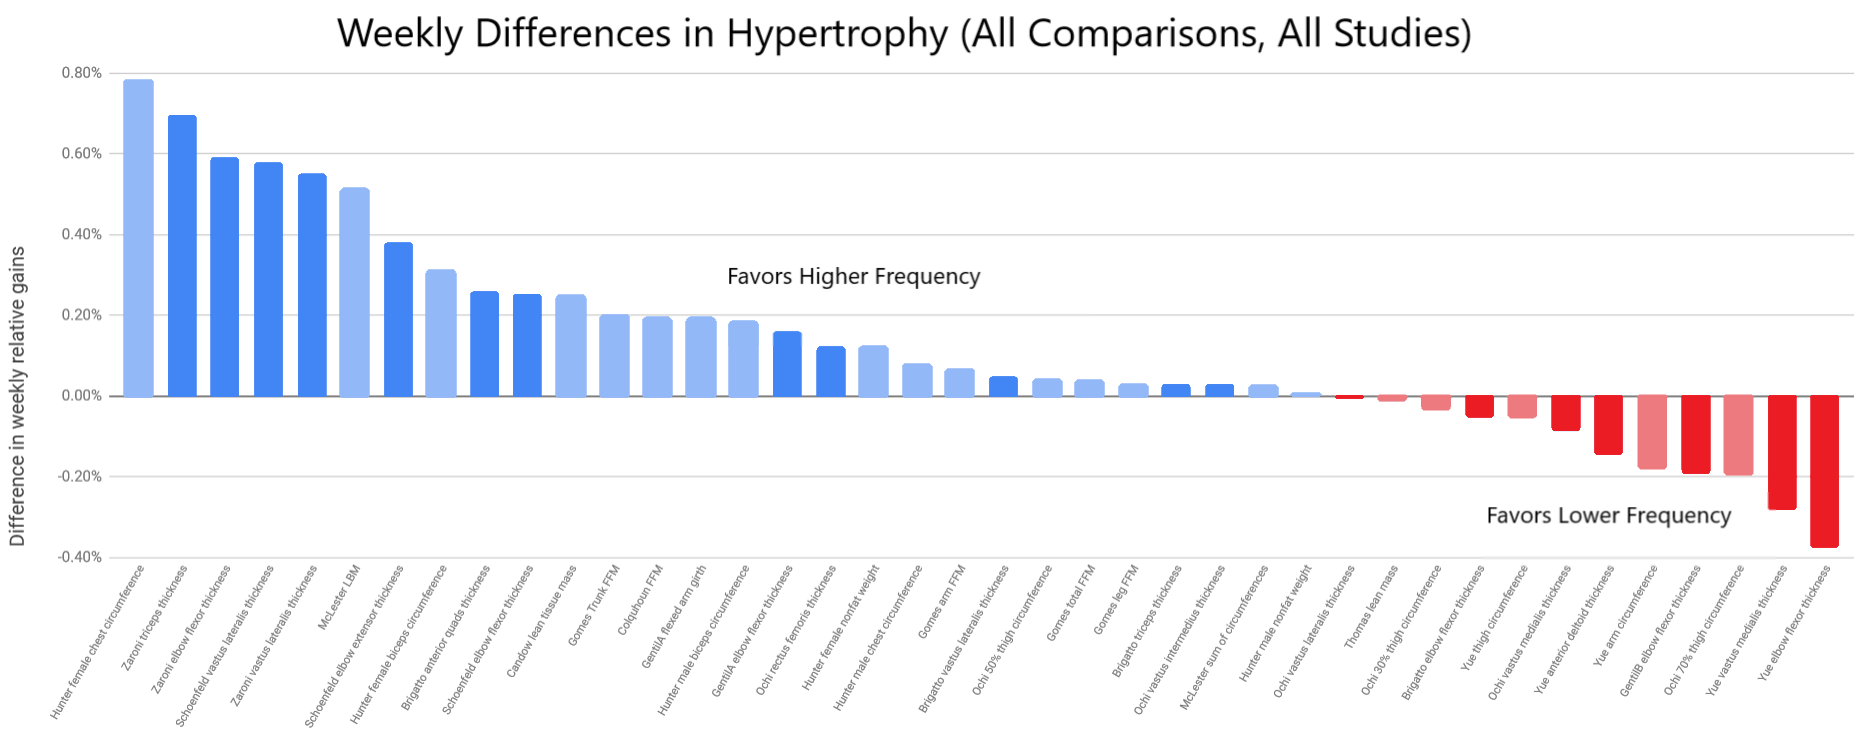
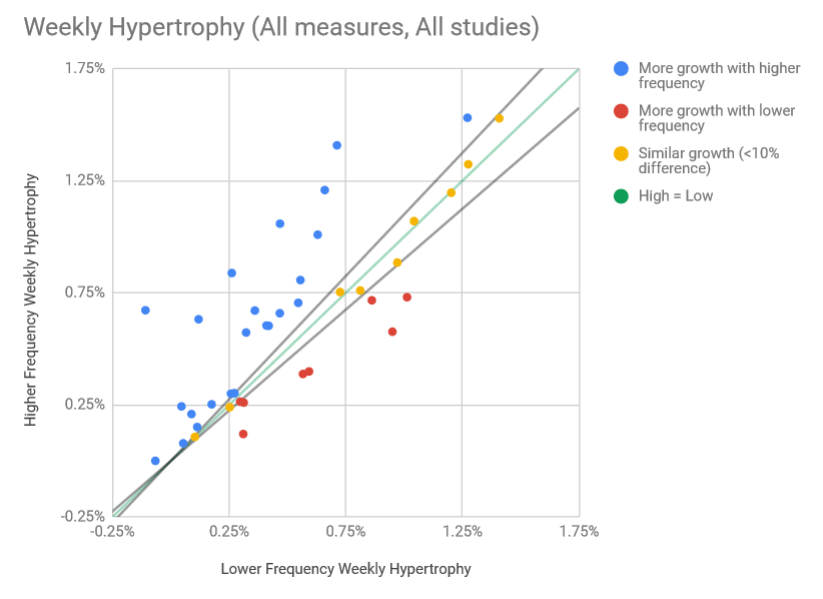
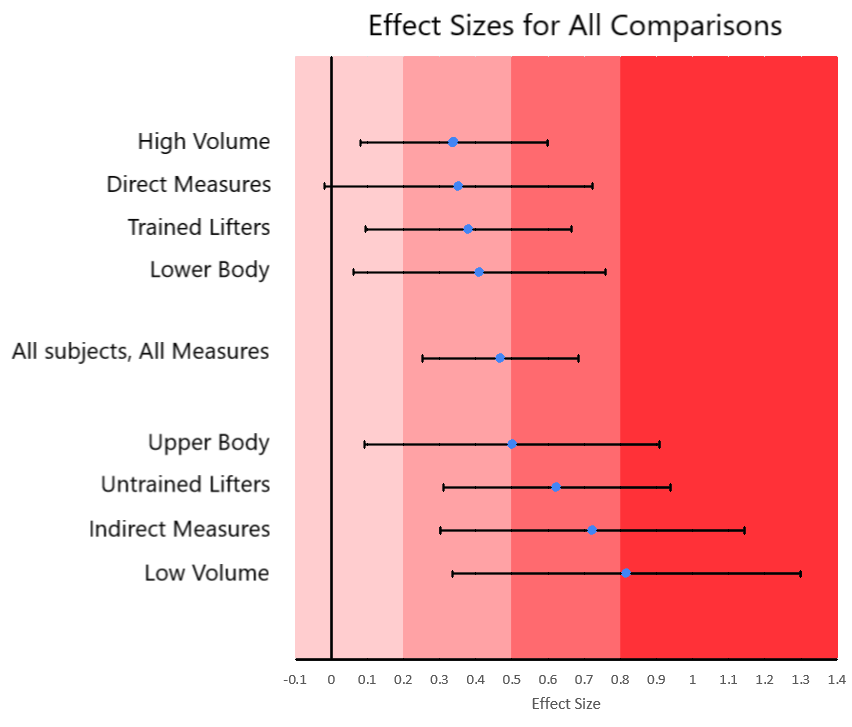
On average, subjects in lower frequency groups (N=40 comparisons across 13 studies) grew at a rate of 0.42% per week, while subjects in higher frequency groups grew at a rate of 0.58% per week. The average difference in size gains between groups was 0.16% per week (CI=0.09-0.23%), meaning the higher frequency groups grew about 38% faster, on average (i.e. 0.58% is 38% larger than 0.42%). This would be classified as a small effect (d=0.47; CI=0.25-0.68), and the difference was significant (p<0.0001).
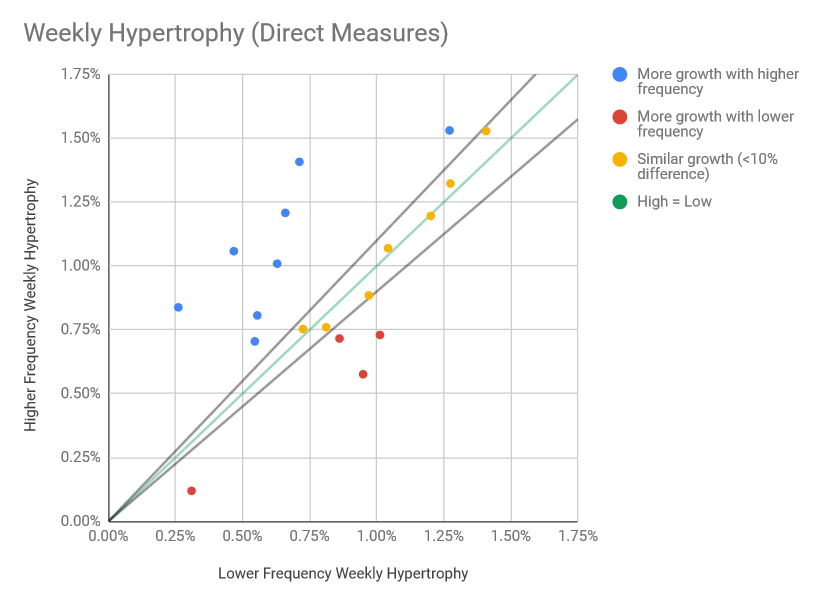
When using direct measures of hypertrophy (N=19 comparisons across 7 studies), subjects in lower frequency groups grew at a rate of 0.72% per week, while subjects in higher frequency groups grew at a rate of 0.85% per week. The average difference in size gains between groups was 0.12% per week (CI=-0.01-0.26%), meaning the higher frequency groups grew about 17% faster, on average. This would be classified as a small effect (d=0.35; CI=-0.02-0.72), and the difference was not significant (p=0.079).
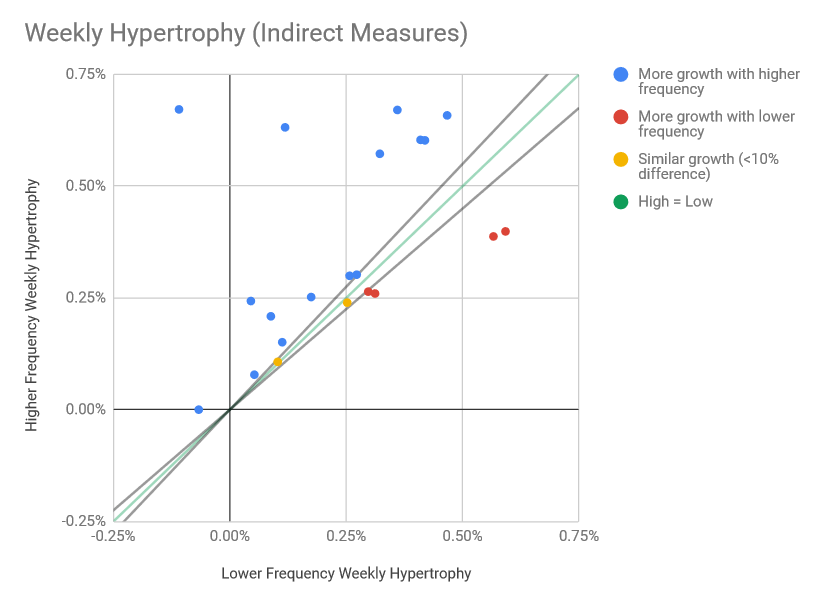
When using indirect measures of hypertrophy (N=21 comparisons across 9 studies), subjects in lower frequency groups grew at a rate of 0.29% per week, while subjects in higher frequency groups grew at a rate of 0.43% per week. The average difference in size gains between groups was 0.14% per week (CI=0.06-0.22%), meaning the higher frequency groups grew about 49% faster, on average. This would be classified as a medium effect (d=0.72; CI=0.30-1.14), and the difference was significant (p=0.0031).
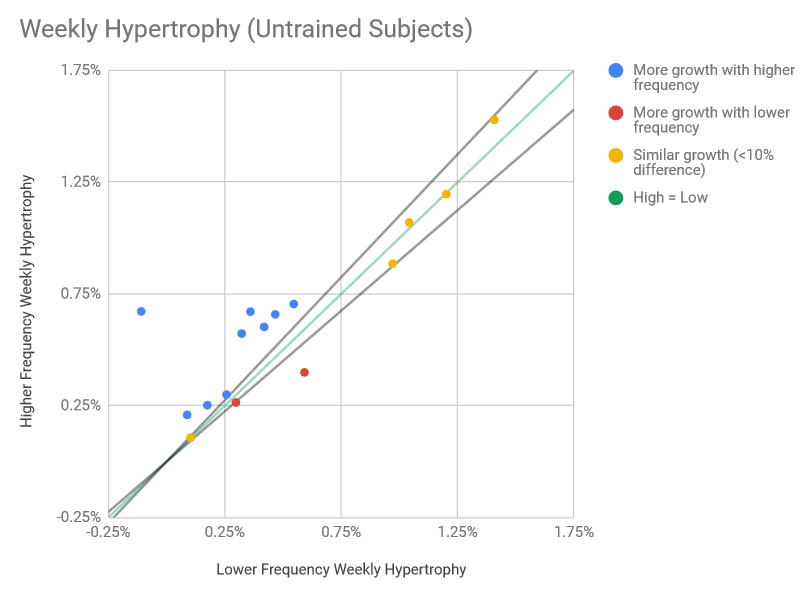
On average, untrained subjects in lower frequency groups (N=16 comparisons across 4 studies) grew at a rate of 0.39% per week, while subjects in higher frequency groups grew at a rate of 0.58% per week. The average difference in size gains between groups was 0.19% per week (CI=0.09-0.28%), meaning the higher frequency groups grew about 47% faster, on average. This would be classified as a medium effect (d=0.62; CI=0.31-0.94), and the difference was significant (p=0.0014).
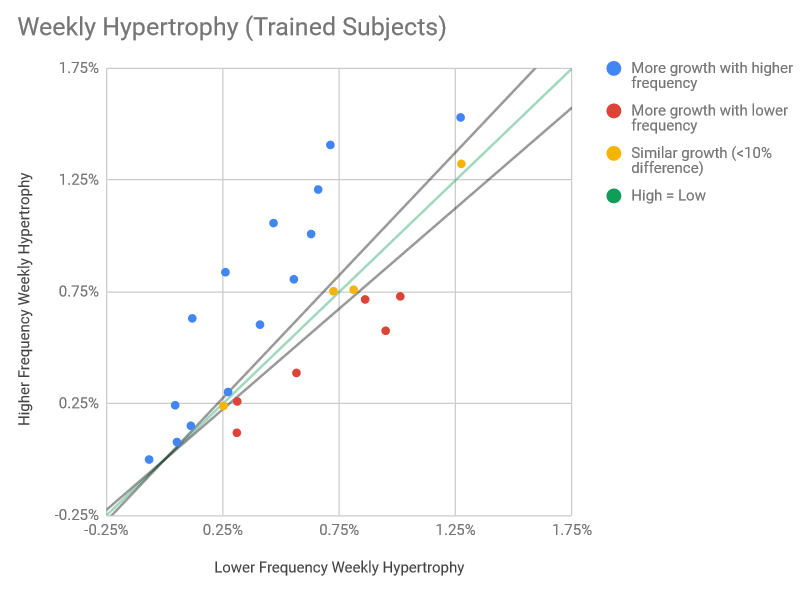
On average, trained subjects in lower frequency groups (N=24 comparisons across 9 studies) grew at a rate of 0.44% per week, while subjects in higher frequency groups grew at a rate of 0.58% per week. The average difference in size gains between groups was 0.14% per week (CI=0.04-0.25%), meaning the higher frequency groups grew about 32% faster, on average. This would be classified as a small effect (d=0.38; CI=0.09-0.67), and the difference was significant (p=0.016).
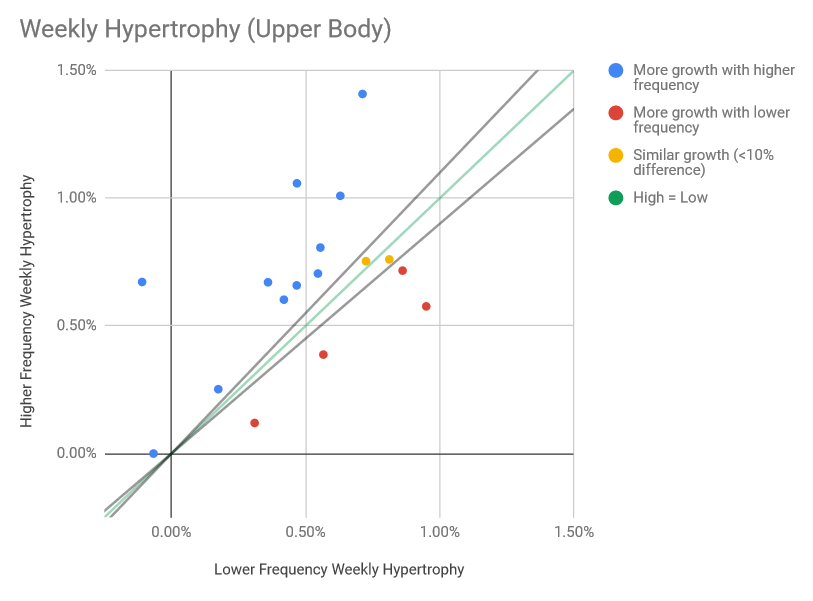
On average, upper body hypertrophy occurred in lower frequency groups (N=17 comparisons across 8 studies) at a rate of 0.42% per week, and occurred in higher frequency groups at a rate of 0.59% per week. The average difference in size gains between groups was 0.17% per week (CI=0.03-0.31%), meaning the higher frequency groups’ upper bodies grew about 40% faster, on average. This would be classified as a medium effect (d=0.50; CI=0.09-0.91), and the difference was significant (p=0.029).
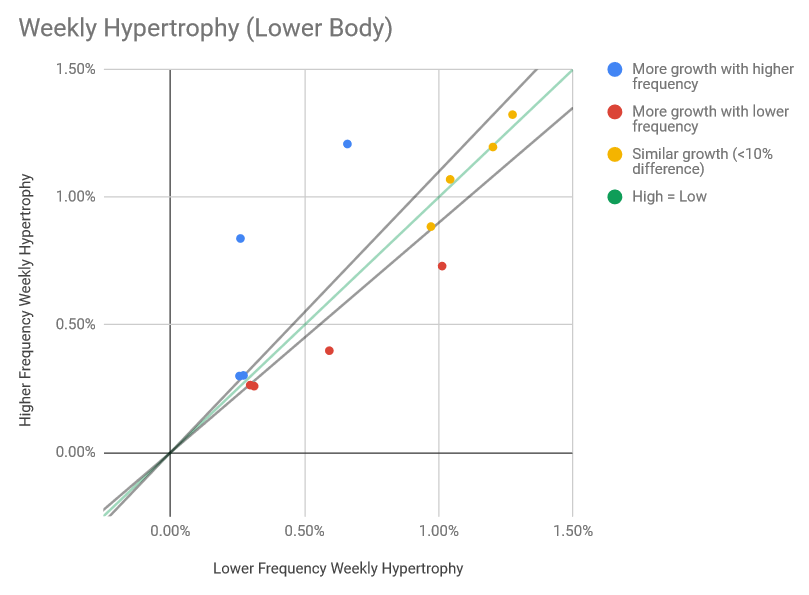
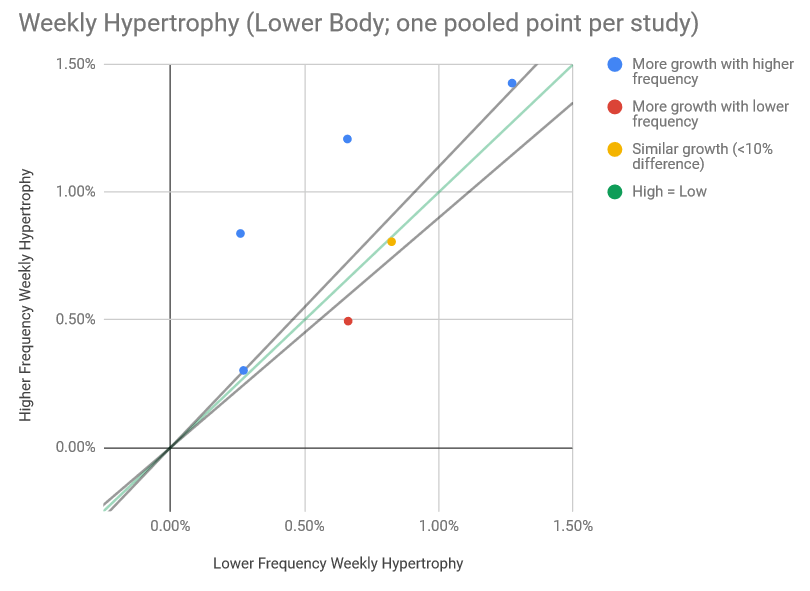
On average, lower body hypertrophy occurred in lower frequency groups (N=14 comparisons across 6 studies) at a rate of 0.65% per week, and occurred in higher frequency groups at a rate of 0.83% per week. The average difference in size gains between groups was 0.18% per week (CI=0.03-0.34%), meaning the higher frequency groups’ lower bodies grew about 28% faster, on average. This would be classified as a small effect (d=0.41; CI=0.06-0.76), and the difference was significant (p=0.038).
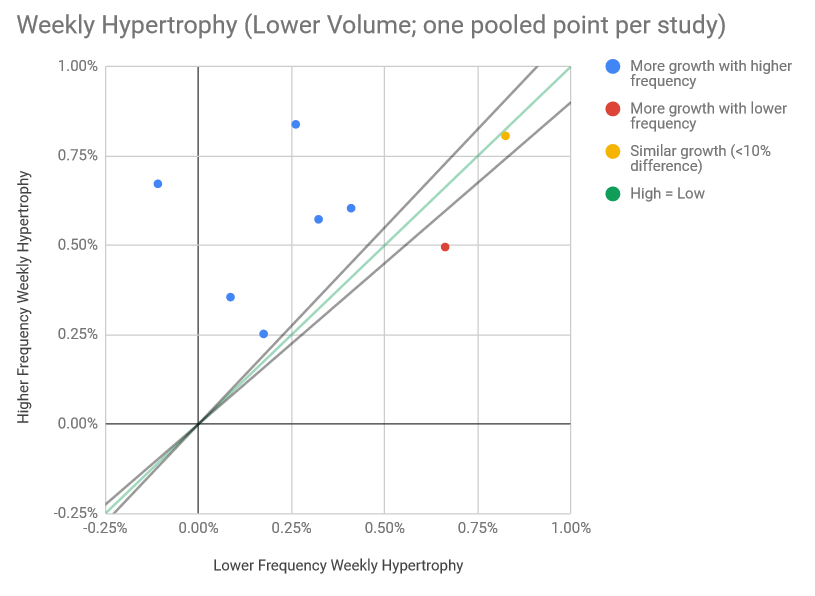
In lower volume studies (N=16 comparisons across 7 studies), subjects in the lower frequency groups grew at a rate of 0.32% per week, on average, while subjects in the higher frequency groups grew at a rate of 0.57% per week. The average difference in size gains between groups was 0.25% per week (CI=0.10-0.40% per week), meaning the higher frequency groups grew about 77% faster, on average. This would be classified as a large effect (d=0.82; CI=0.34-1.30), and the difference was significant (p=0.0046).
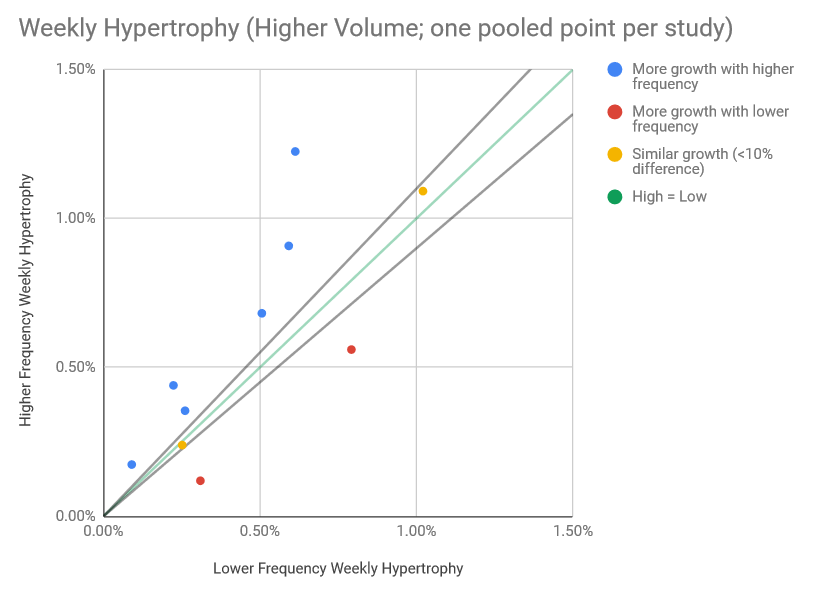
In higher volume studies (N=24 comparisons across 9 studies), subjects in the lower frequency groups grew at a rate of 0.46% per week, on average, while subjects in the higher frequency groups grew at a rate of 0.58% per week. The average difference in size gains between groups was 0.12% per week (CI=0.03-0.21% per week), meaning the higher frequency groups grew about 27% faster, on average. This would be classified as a small effect (d=0.34; CI=0.08-0.60), and the difference was significant (p=0.017).
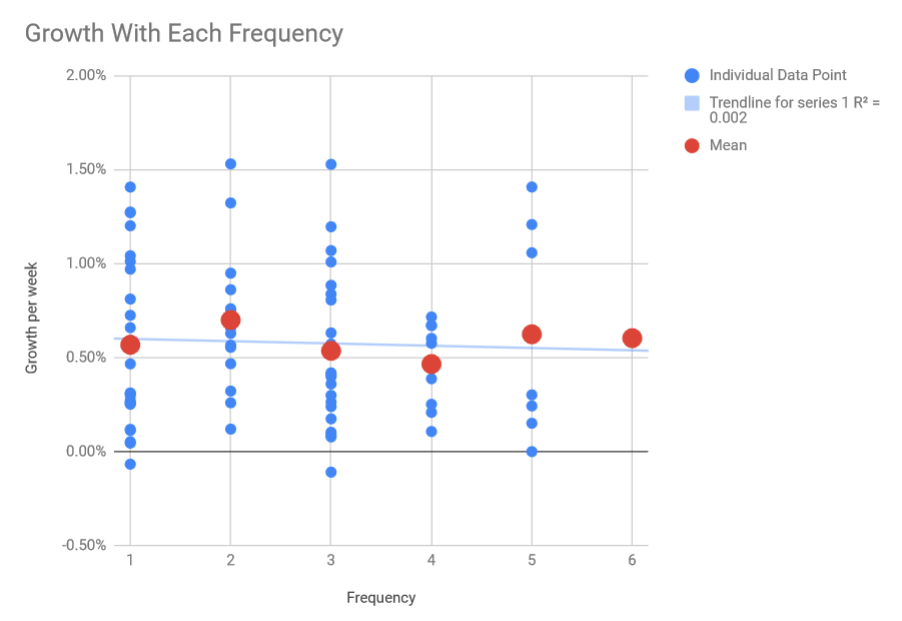
When simply looking at average hypertrophy reported with each frequency across all studies, there doesn’t seem to be a significant relationship between frequency and hypertrophy. When running a simple linear regression, the correlation coefficient is basically zero (r=-0.04).
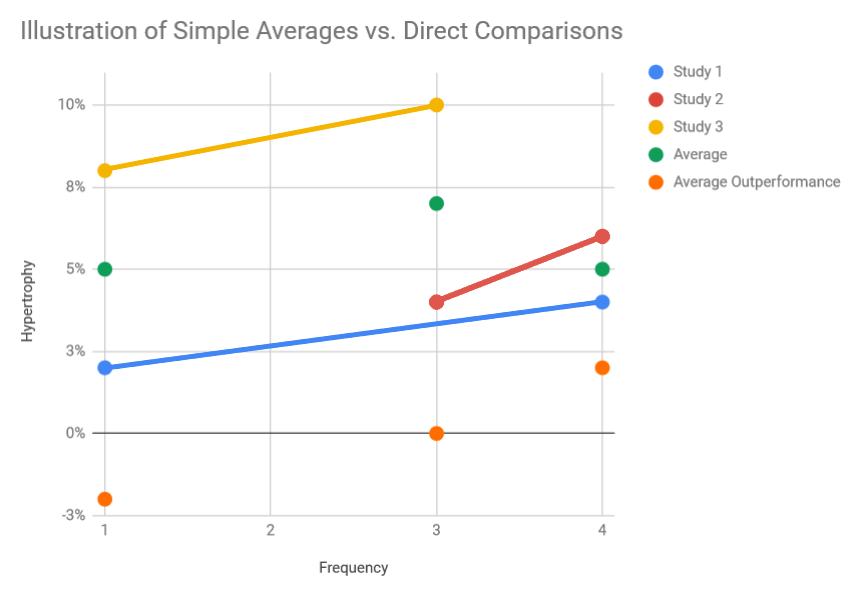
However, as explained in the previous article on the relationship between frequency and strength gains, simply comparing the average hypertrophy seen with different frequencies doesn’t do anything to address the differences in hypertrophy observed between studies. Imagine you have three studies. One compares a frequency of once per week to a frequency of four times per week, the second compares a frequency of three times per week to a frequency of four times per week, and the third compares a frequency of once per week to a frequency of three times per week. In the first study, the low frequency group (1x) grows by 2% and the high frequency group (4x) grows by 4%. In the second study, the low frequency group (3x) grows by 4% and the high frequency group (4x) grows by 6%. In the third study, the low frequency group (1x) grows by 8%, while the high frequency group (3x) grows by 10%. Just averaging the size gains, you see a 5% increase with once per week [(2%+8%)/2], a 7% increase with three times per week[(4%+10%)/2], and a 5% increase [(4%+6%)/2] with four times per week. It looks like 1x per week and 4x per week lead to similar gains, while 3x per week leads to the largest gains; however, those conclusions are driven by differences between studies, not differences between frequencies. With direct comparisons, on the other hand, 1x underperforms both 3x and 4x by 2%, 3x overperforms 1x by 2% and underperforms 4x by 2% (average 0%), and 4x overperforms both 1x and 3x by 2%. This more accurately represents the results in this imaginary trio of studies, because it does a better job accounting for the variability of results between studies.
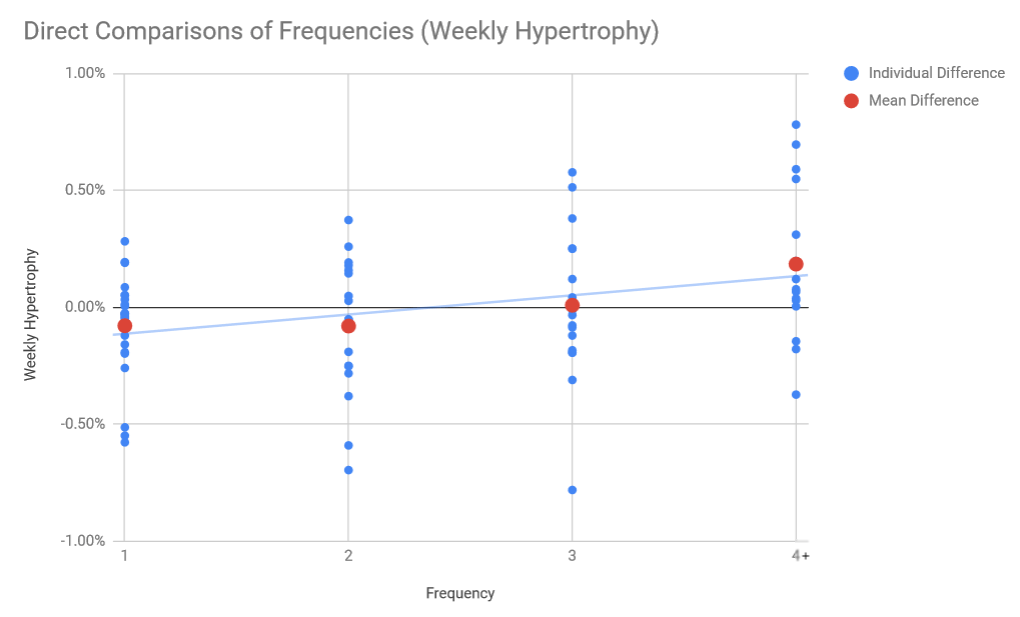
When a frequency of once per week (N=25 comparisons from 10 studies) was directly compared to other frequencies, it slightly underperformed in direct comparisons by 0.079% per week. A frequency of twice per week (N=17 comparisons from 7 studies) slightly underperformed in direct comparisons by 0.080% per week. A frequency of three times per week (N=21 comparisons from 7 studies) essentially performed at par in direct comparisons (minimally outperforming by 0.009% per week). A frequency of four times per week (N=9 comparisons from 2 studies) slightly overperformed by 0.087% per week. A frequency of five times per week (N=7 comparisons from 2 studies) overperformed by 0.310% per week. And finally, a frequency of six times per week overperformed by 0.194% per week, but there was only one measure from one study examining a frequency that high. Since there are fewer studies examining higher frequencies exceeding three times per week, we’ll again pool the results of studies using frequencies of 4+ times per week (N=17 comparisons from 5 studies), finding that they overperformed in direct comparisons by 0.185% per week. Higher frequencies were associated with greater hypertrophy in direct comparisons (r=0.32, p=0.0036).
Given the linear relationship between frequency and hypertrophic overperformance in direct comparisons, I checked the results of studies comparing frequencies of once or twice per week to frequencies of 3+ times per week, and studies comparing frequencies of 1-3 times per week to frequencies of 4+ times per week to verify the results of the regression analysis. Twenty four measures from eight studies were included in the first comparison, and 17 measures from five studies were included in the second comparison. In both comparisons, higher frequency groups experienced significantly faster hypertrophy. The effect size was small (d=0.33) when comparing frequencies 1-2 vs. 3+, and medium (d=0.51) when comparing frequencies of 1-3 vs. 4+.
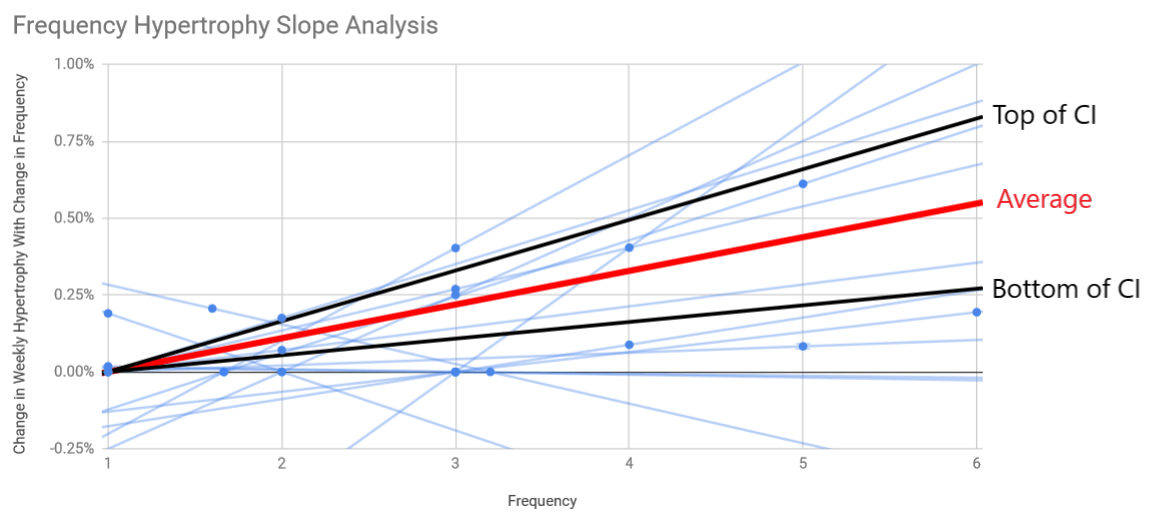
Since there seems to be a roughly linear relationship between frequency and hypertrophy, we can again analyze slopes to see how much additional hypertrophy one could expect by increasing frequency. Each additional day of frequency increased weekly hypertrophy by 0.11% (CI=0.05-0.16% per week). The average rate of hypertrophy across all frequencies in all studies was 0.50% per week, meaning each additional day of frequency led to 22% more hypertrophy, on average. This slope was significantly different from zero (p=0.0004).
Discussion
First off, I’d like to start by saying that I feel way better about analyzing strength data than hypertrophy data. Strength measures are generally nice and clean, and changes are generally pretty clear. There’s not a ton of measurement error for 1RM tests or torque measurements, and strength gains are typically large enough that you can be confident you’re seeing true changes. Plus, poor adherence to pre-testing guidelines generally won’t screw up strength tests too badly. It’s not going to make a night-and-day difference if someone accidentally drank some caffeine before testing, or if they forgot to show up to the lab fasted (you try to control those things, of course, but sometimes human subjects lie; for strength testing, stuff like that just doesn’t make THAT big of a difference).
With hypertrophy, on the other hand, the changes are typically much smaller (for example, the weekly strength gains in my previous analysis were roughly 4x as large as the weekly hypertrophy in this analysis, even though both analyses used mostly the same set of studies), and sometimes don’t even exceed the measurement error of the device you’re using for testing. Poor adherence to pre-testing guidelines can also make a huge difference, especially for indirect measures of hypertrophy (this is a great article from James Krieger about how to mangle DEXA results). Equipment issues are also worth noting; if you have a good ultrasound unit that shows you really clear fascial boundaries, muscle thickness or CSA measurements are a breeze; if you have an older ultrasound unit, there’s a reasonable amount of guesswork that goes into it.
I say all of this just to note that I have a bit less confidence in these results than I had in my strength results, simply because I’m a bit less trusting of hypertrophy data in general. Collecting good strength data is fairly easy; collecting good hypertrophy data requires more trust in your participants and your equipment, when you’re already trying to find smaller absolute changes or differences.
There also just aren’t any comparisons in this analysis that are as clean as the effects of frequency on upper body pressing strength from the last article. All studies on pressing strength either found larger strength gains with higher frequencies, or similar strength gains regardless of frequency. In this article, all comparisons had at least one study finding >10% more hypertrophy with lower frequency.
Painting in broad strokes, higher frequencies seem to have a larger effect for untrained subjects than trained subjects, for low training volumes than high training volumes, and when you’re assessing hypertrophy using indirect measures (i.e. lean body mass) than direct measures (i.e. muscle thicknesses). Most of the differences were still significant in favor of higher frequencies, but the relative advantage of higher frequencies seems to be smaller if you’re a trained lifter (32% vs. 47% for untrained), if you have high training volumes (27% vs. 77% for low training volumes), and if you’re interested more in growing specific muscles than simply gaining lean mass (17% for direct measures, vs. 49% for indirect measures).
So, the question becomes: Why might higher frequencies be better for muscle growth?
I think the most obvious explanation would be that higher frequencies allow you to stimulate muscle protein synthesis (MPS) more times throughout the week. Unfortunately, most of the MPS data we have come from studies looking at mixed MPS, whereas myofibrillar MPS is what we really care about. There’s also a dose-response relationship between per-session training volume and per-session MPS (i.e. muscle protein synthesis isn’t just an on/off switch; if you do more volume during a session, MPS will elevate more and be elevated for longer following that session), so it’s not clear that training a muscle more frequently with lower per-session volume actually causes more total MPS throughout an entire week. Now, if that dose-response relationship was really fleshed out, we may be able to use that information for some theory crafting. For example, if we found a plateau in per-session MPS after 5 sets for a given muscle, we may be able to posit, with some degree of confidence, that doing 5 sets, four times per week would be better than 10 sets, twice per week. However, we don’t yet have that level of granularity.
A second potential explanation could simply be higher volumes with higher frequencies. Volume during working sets was equated in all of these studies, but the higher frequency groups would have completed more total warm-up sets over the course of the program. While warm-up sets certainly won’t affect hypertrophy as much as working sets, they still cause some level of training stress.
A third potential explanation may simply be the effort and energy that could be put forth in each set. If you know you have to do a bunch of sets of the same exercise, or if you have to get through a lot of sets within a single training session, it’s natural to hold back a bit at the beginning so you’ll have some energy left at the end of the session, or to start slacking a bit near the end of the session as you start to fatigue (I’m sure that doesn’t apply to you, individually, because I’m sure you’re a total badass. But it’s natural human tendency). Having research assistants present to push the subjects helps rein in these tendencies, of course, but I doubt that completely ameliorated the difference in per-set effort. In one of the studies included in this analysis, per-session internal training load was ~35% lower in the higher frequency group, and total volume load ended up being 16% higher; another study had very similar findings. Another study also found lower ratings of perceived exertion (using an effort-based scale, not a reps-in-reserve based scale) in the higher frequency group. So, we know that the subjects found each session easier, on average, which sometimes translated into higher volume loads, so I think that higher per-set effort probably played an important role.
Two questions came up repeatedly after my strength article that are worth addressing here:
1) Is it OK to train the same muscle on back-to-back days when it’s still sore?
2) Won’t higher frequencies increase injury risk?
Most of the studies looking at the time course of recovery after training find that it can take 2-4+ days for muscles to fully recover after a challenging training session (depending on training status, volume, degree of eccentric stress, etc.). Most people assume that you should wait for a muscle to fully recover before training it again. However, there’s not any good evidence (that I’m aware of) to support that assumption. In fact, there are three studies (one, two, three) comparing consecutive versus nonconsecutive training (i.e. training the same muscles on back-to-back-to-back days, versus resting at least 48 hours between training sessions for the same muscle group), and none of the three have found any negative effects for consecutive training. Now, all three of those studies used untrained or recreationally trained lifters, but they’re the only direct evidence we have. Also, keep in mind that with higher frequencies, per-session volume per muscle group should be lower, which makes training the same muscle on back-to-back days much more doable.
As for injury risk, I think there’s a scientifically correct answer, and a practically correct answer.
A recent study in powerlifters found pretty weak associations between training frequency and injury risk (in some analyses, there was a positive association; and in some analyses, there was a negative association). Furthermore, most acute injuries tend to occur when you’re fatigued, and focus or motor control start slipping, so I’d assume that higher frequencies may decrease acute injury risk by decreasing per-session volume. I think the effect of frequency on chronic injury risk would largely be determined by technical proficiency. With good technique, I doubt higher frequencies would increase chronic injury risk. With poor technique, though, it wouldn’t surprise me if higher frequencies increased chronic injury risk by frequently exposing your tendons and/or ligaments to excessive stress. That’s the scientific answer.
The practical answer is that is probably depends on how you approach training psychologically. If you like to go all-out on every set and keep per-session volume high for each muscle group you train so that you feel like you’ve really thrashed yourself by the end of a workout, high frequencies are probably a very bad idea for you. If you take a more relaxed approach to training (and lift with good technique), you’ll probably be fine with higher frequencies.
There’s one final issue I want to address before wrapping up: If you’re a Weightology subscriber, you probably know that James Krieger has a guide covering this same topic (and if you’re not a Weightology subscriber, you should rectify that issue right after you subscribe to MASS). If you’ve read it, you’ll probably also notice that our results differ. There are a few reasons for that:
1) James includes a few studies that I don’t. There’s a study by Arazi and Abbas I didn’t include because it doesn’t include any information about training volume. His analysis also includes a few unpublished studies that are currently in review.
2) When analyzing the dose-response relationship between frequency and hypertrophy, it seems that James is pooling the effect sizes and percent increases with each frequency, rather than analyzing how each frequency performs in direct comparisons against other frequencies. That is certainly the standard approach, but as I explained in this article, I think it’s more apt to pick up differences between studies, rather than differences between frequencies within those studies.
Edit: I spoke with James, and he said he model does also model between-study variance. I’d need to dig into the nuts and bolts of his model more to fully understand the issue, then, because our results differ drastically.
3) For these analyses, I tend to take a slightly more liberal (but certainly still valid) statistical approach than James. My reasoning for this is that my audience is primarily composed of lifters and coaches, and I think lifters and coaches should approach type I and type II error differently than scientists.
[ A brief philosophy of science interlude ]
In science, a type I error – a false positive – is the type of error you aim to avoid at all costs. On the other hand, a type II error – a false negative – is much more acceptable. If A is not different from B, but you say it is, that’s really bad. If A is different from B, but you say it isn’t, that’s not nearly as big of a deal. There are a few reasons that science is oriented this way, but the main purpose is to keep people from spending a ton of time and research dollars attempting to investigate and flesh out an idea that wasn’t true in the first place. Science is a self-correcting process, but you really want to make sure that most of the time and resources within the sciences are spent making actual progress, not self-correcting avoidable mistakes. The stakes are often quite high as well. If you’re developing a new drug, you want to be really confident it’s better than the currently prescribed drug that it’s replacing, because being wrong could cost lives.
For an athlete or coach, the calculus is different. The stakes are generally lower (it’s not a life-or-death situation; you’ll probably be able to make gains with any training frequency), and the standard of evidence you should require before making a decision should be lower as well. When troubleshooting a lifter’s training program, you rarely have the luxury of waiting to try something new until you’re 95%+ confident you’re making the absolute optimal choice for that athlete. If you’re 70% sure something will help, and the costs or risks associated with that decision are minimal, it typically makes sense to pull the trigger. Type II errors (the opportunity cost of forgoing something that could have helped) are just as costly as type I errors (trying something that doesn’t help).
With all of that being said, the analyses I run are still kosher procedures that certainly prioritize limiting Type I errors. I’m still calculating confidence intervals and aiming to reject a null hypothesis (a maximally liberal approach would involve just comparing mean point estimates). They’re just not quite as conservative as James’ analyses, because I also don’t want to unnecessarily inflate type II error, given the audience of this site and the purpose of my articles (making recommendations that have the highest probability of being helpful for athletes and coaches).
[/end interlude]As one final point before we wrap up: I think the volume-matched literature (reviewed in this article) may underestimate the effects of frequency on hypertrophy. We know that volume seems to be the largest driver of hypertrophy, and generally increases in frequency allow for increases in volume. Doing 20 sets of squats in a single session will mangle most people, but doing 5 sets of squats, four times per week is generally challenging but doable. I do think that higher frequencies may increase the risk inherent in increasing volume, though. If you only train legs once per week and you go overboard in one session, at least you have a week to recover before training legs again; most people can recover from damn near anything in a week. If you train legs four times per week and your volume is too high, however, it’s easier to keep digging yourself deeper and deeper into a hole, increasing your risk of overreaching or overtraining. So, increasing frequency can be beneficial, but you need to be smart about it. Effectively monitoring recovery probably becomes more important with higher training frequencies.
Practical Recommendations for Training Frequency
So, let’s end with some practical recommendations:
1) If you’re currently making progress on a low frequency training program, don’t change anything. When you plateau, however, consider increasing your training frequency.
2) Many lifters, anecdotally, find that they can tolerate higher frequencies for some exercises or muscle groups but not others. Higher training frequencies are worth a shot, but keep in mind that your personal responses may not mirror the average response.
3) If you increase your training frequency, start by distributing your current training volume over more days per week. Don’t increase volume until you see how you respond and how well you can recover between sessions.
4) If training purely for hypertrophy with a high frequency, consider alternating between more and less taxing exercises for each muscle group. For example, if you do squats on Monday to train quads, do something lighter like step-ups or split squats on Tuesday or Wednesday.
5) I’d primarily recommend higher frequencies when training to bring up weak points, or when weekly volume for a given muscle group is low. They’re useful in other contexts, but those are the situations where I think they’d give you the largest return on investment.
If you’ve made it this far, you should consider signing up for Monthly Applications in Strength Sport. It’s a research review that Eric Helms, Mike Zourdos, and I publish every month, breaking down the recent research that’s most relevant and useful for strength and physique athletes and coaches. You can snag a free issue here if you’d like to check it out.