

Note: This article was the MASS Research Review cover story for December 2023 and is a review of a recent paper by Nuzzo et al. If you want more content like this, subscribe to MASS.
Key Points
- Researchers conducted a meta-regression to quantify the number of reps that could be performed at specific percentages of 1RM.
- On average, more reps could be performed at moderate loads than previously thought. There is a large interindividual variation in rep performance, and that rep performance is exercise-specific.
- This meta-regression provides an important update to the loading chart that was constructed in the early 1990s. Percentage-based training utilizing loading charts has generally fallen out of favor, but the updates provided in this meta-regression may allow for more accurate percentage-based training in group settings.
When I first became serious about the training, I knew it all. I took every set to failure, ate a billion calories within seconds of finishing a workout, and made sure training was the most important part of my day. I’d also use loading charts to program the number of reps to complete at a specific percentage of 1RM (e.g., 12 reps at 70% of 1RM). If I performed 10 reps at a specific load, I would immediately go to the percentage chart and work backwards to determine my new max. These charts were based on science, I presumed, so the programming and 1RM predictions were accurate. Right?
Years later, I learned that these charts were based on only a couple studies from a single research group (2, 3). In retrospect, the lack of scientific rigor associated with these charts made sense, as I would often complete a different number of reps than the chart suggested. Furthermore, there is a large degree of inter-individual variation in the number of reps performed at a specific percentage of 1RM (4, 5), and rep performance can vary within an individual from day to day. We now have autoregulatory tools, such as repetitions in reserve (RIR) (6) and velocity-based training (7), that provide alternative load prescription options. Nonetheless, a loading chart can provide a decent starting point, which can be helpful for a new lifter or for a coach who has a ton of athletes and insufficient time or resources to implement velocity-based or RIR-based training. Further, a new meta-regression from Nuzzo et al (1) uses data from numerous studies to create an updated loading chart and quantify the interindividual variation associated with its values.
Purpose and Hypotheses
Purpose
The presently reviewed meta-analysis had three main aims:
- Provide a comprehensive update of loading charts to determine, on average, how many reps can be performed at specific percentages of 1RM
- To examine the degree of interindividual variation in reps performed at specific percentages of 1RM
- To examine whether various moderators, such as sex, exercise, and training status influenced reps performed.
Hypotheses
As is customary in a meta-analysis, the researchers did not state a hypothesis.
Subjects and Methods
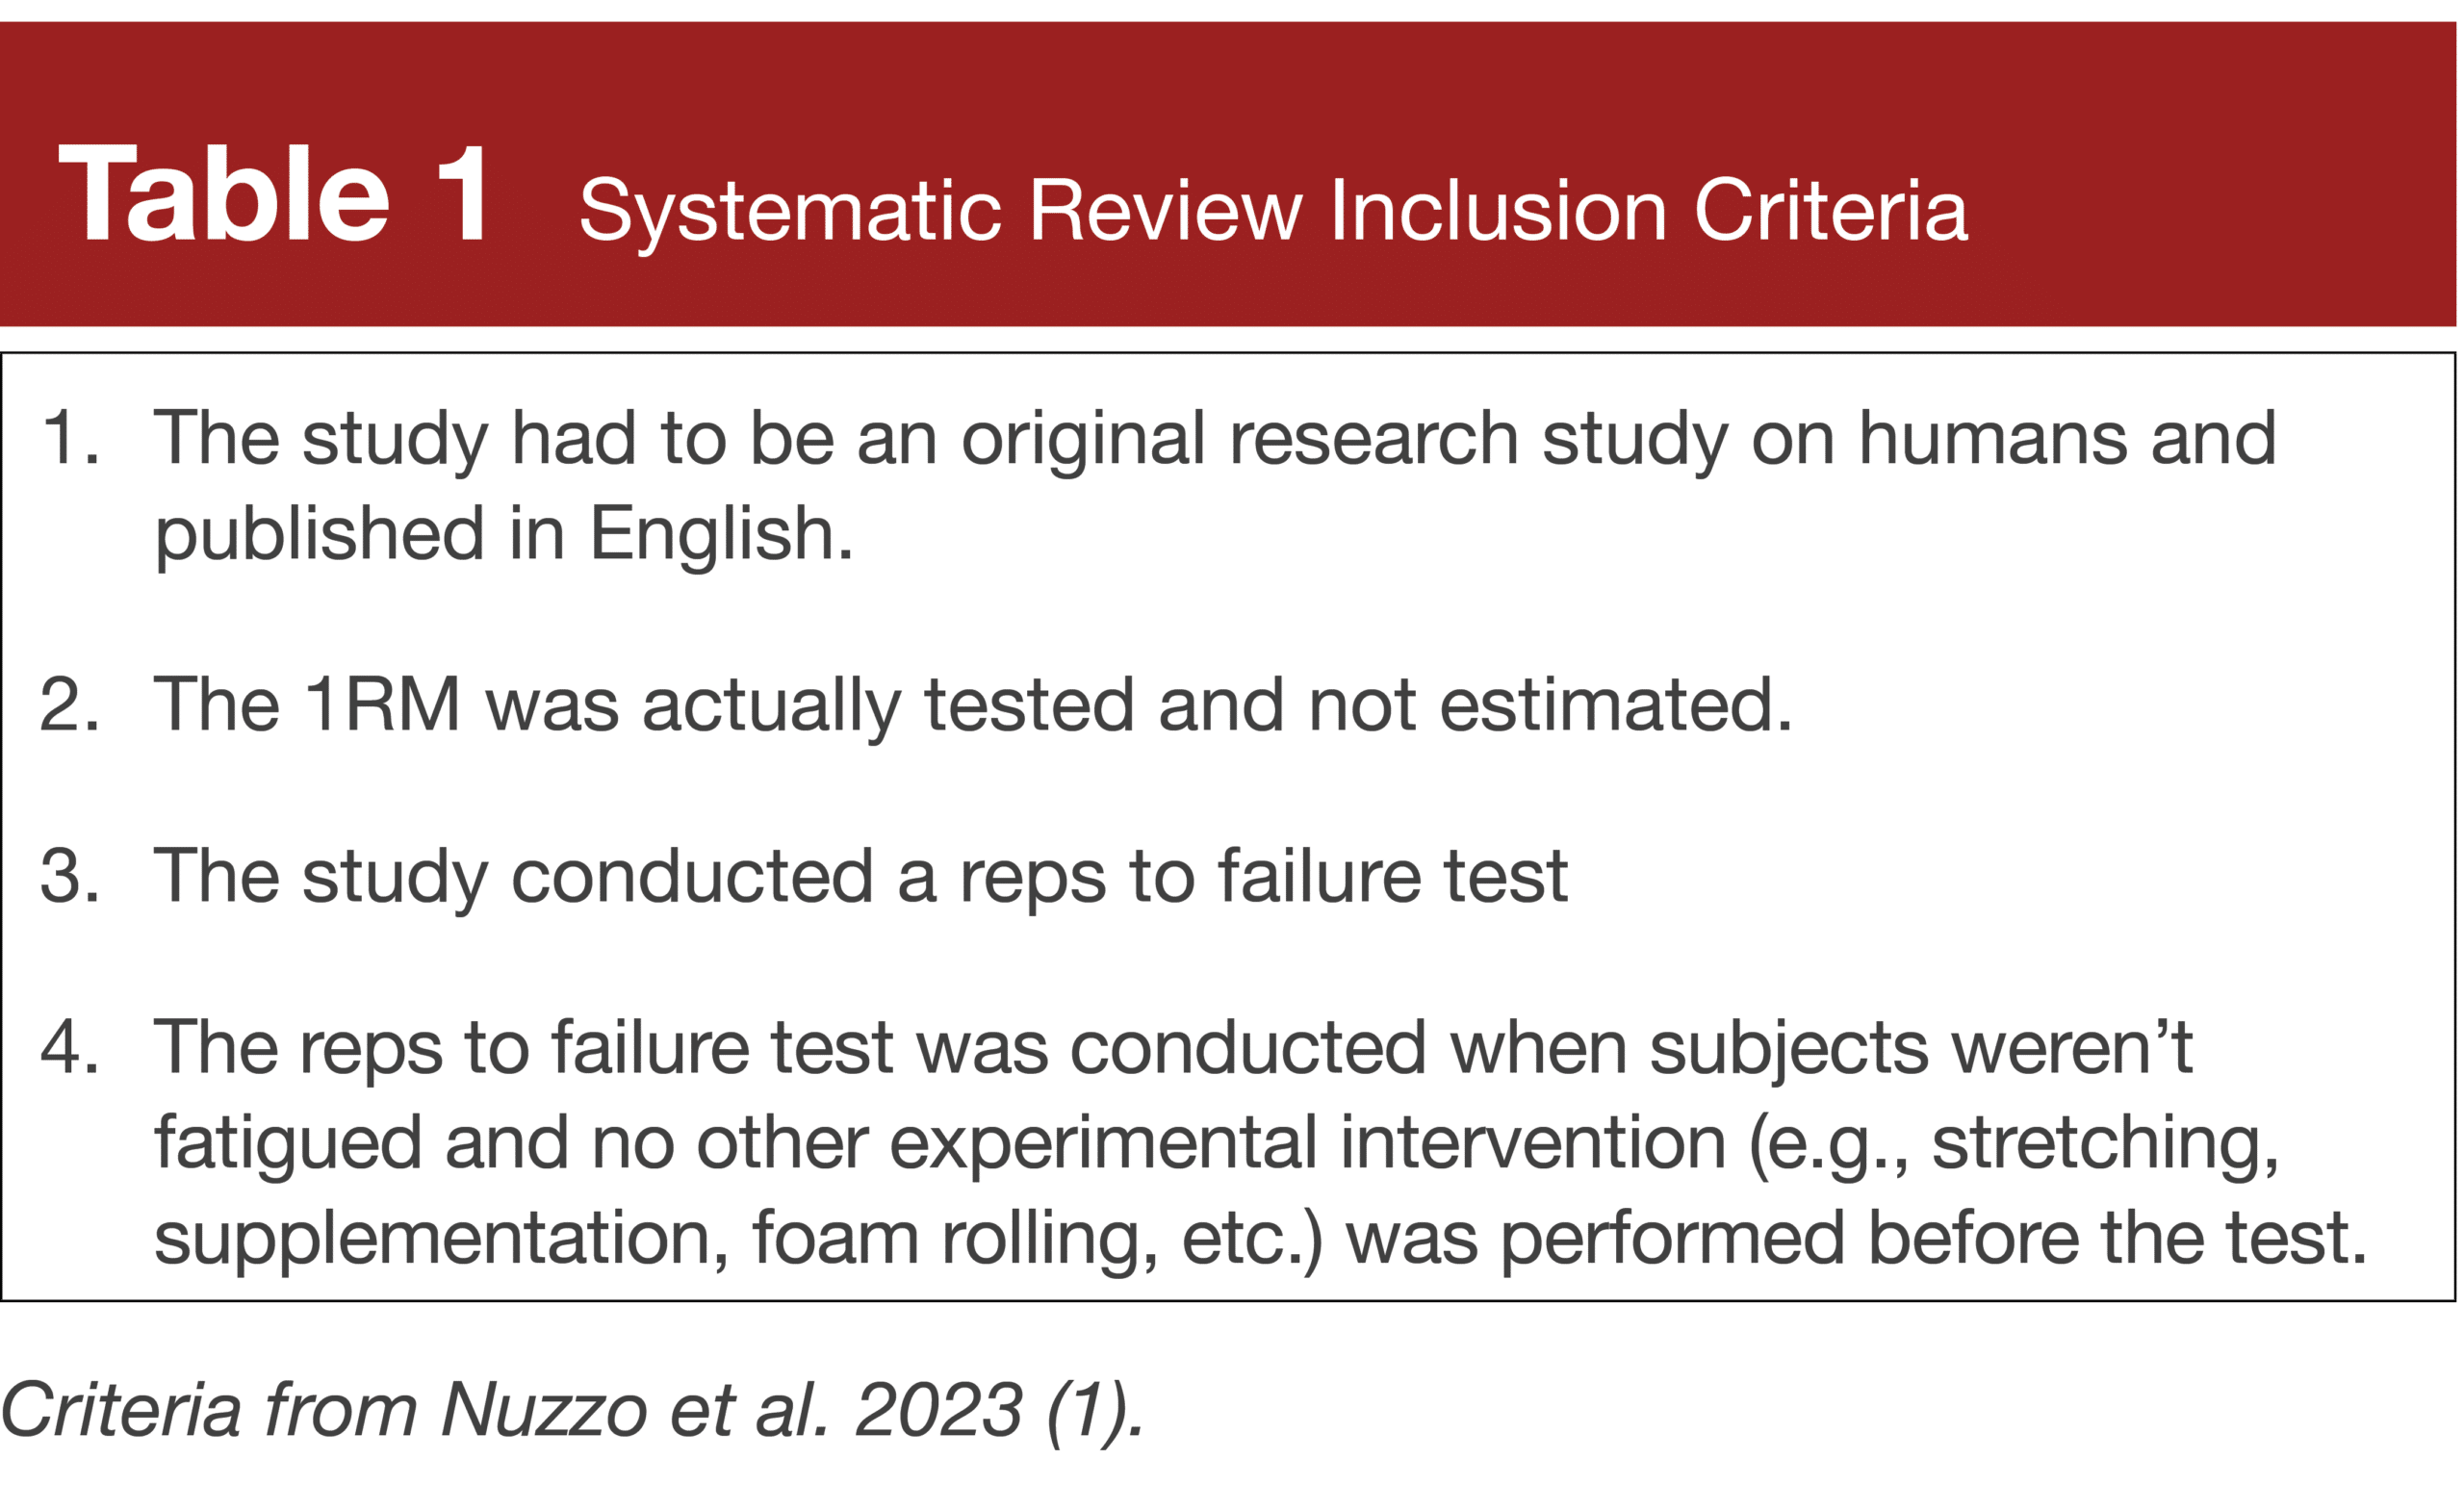
In this study, Nuzzo et al. (1) systematically searched various databases through February 2023 using specific criteria to identify all studies addressing their research questions. In addition to searching databases, the researchers also included studies in the analysis that they had personal knowledge of, even if they did not appear in the search.
The researchers included data from 962 reps-to-failure tests completed by over 7,000 individuals across 92 studies. 66% of the subjects were male, 60% were trained individuals, 92% were < 59 years old, and the most commonly analyzed exercises were the bench press (14% of sets), leg press (12%), leg extension (11%), and chest press (9%). Additionally, free-weight and Smith machine data for a specific exercise (e.g., bench press) were combined in the analysis because many studies did not clarify which was used.
To analyze the data, researchers created multiple models predicting repetitions completed based on the relative load used (percentage of 1RM). The outcome variable (repetitions completed) was log-transformed to improve the statistical properties of the models.. The linear and cubic spline models provided the best fit for the data. The researchers determined the estimated means, standard deviations, and 95% confidence intervals to construct an updated loading chart. They also examined whether sex, age, training status, and exercise influenced the number of reps performed at specific percentages of 1RM.
Findings
Exercise was the only moderator that appeared to meaningfully affect the findings. In addition to providing updated loading charts for all exercises together, they also included exercise-specific loading charts for bench press and leg press. The other exercises (leg extension and chest press) fit better with the main loading chart for all exercises.
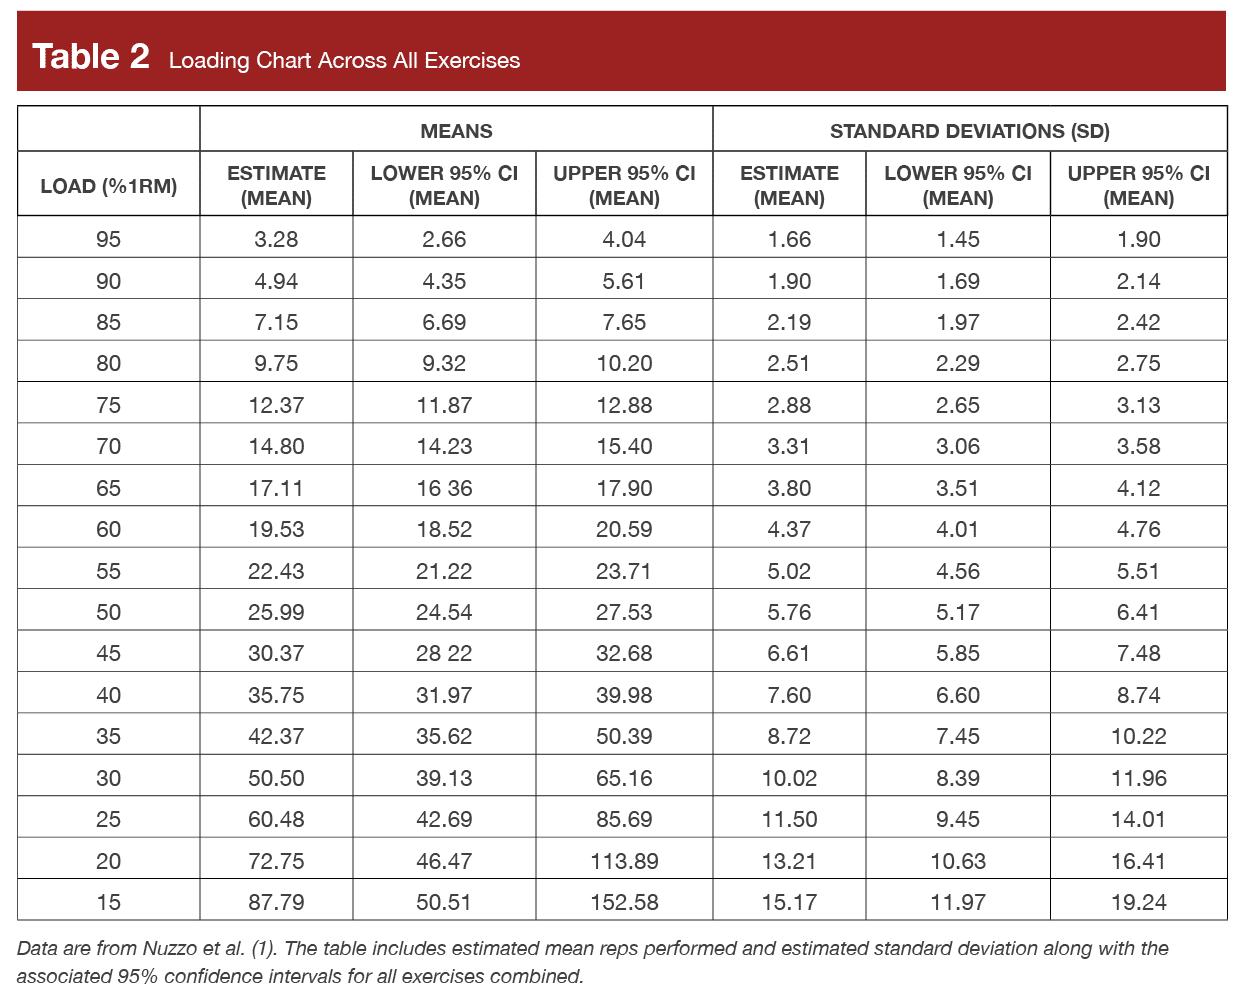
At most percentages of 1RM, reps performed were estimated to be greater than the most commonly used loading chart. For example, this analysis estimated that across all exercises, on average, 14.80 reps were performed at 70% of 1RM, while the widely used chart suggests that 12 reps can be performed at 70% of 1RM. The researchers also found that interindividual variation in reps was higher as the percentage of 1RM decreased.
Bench Press Loading Chart
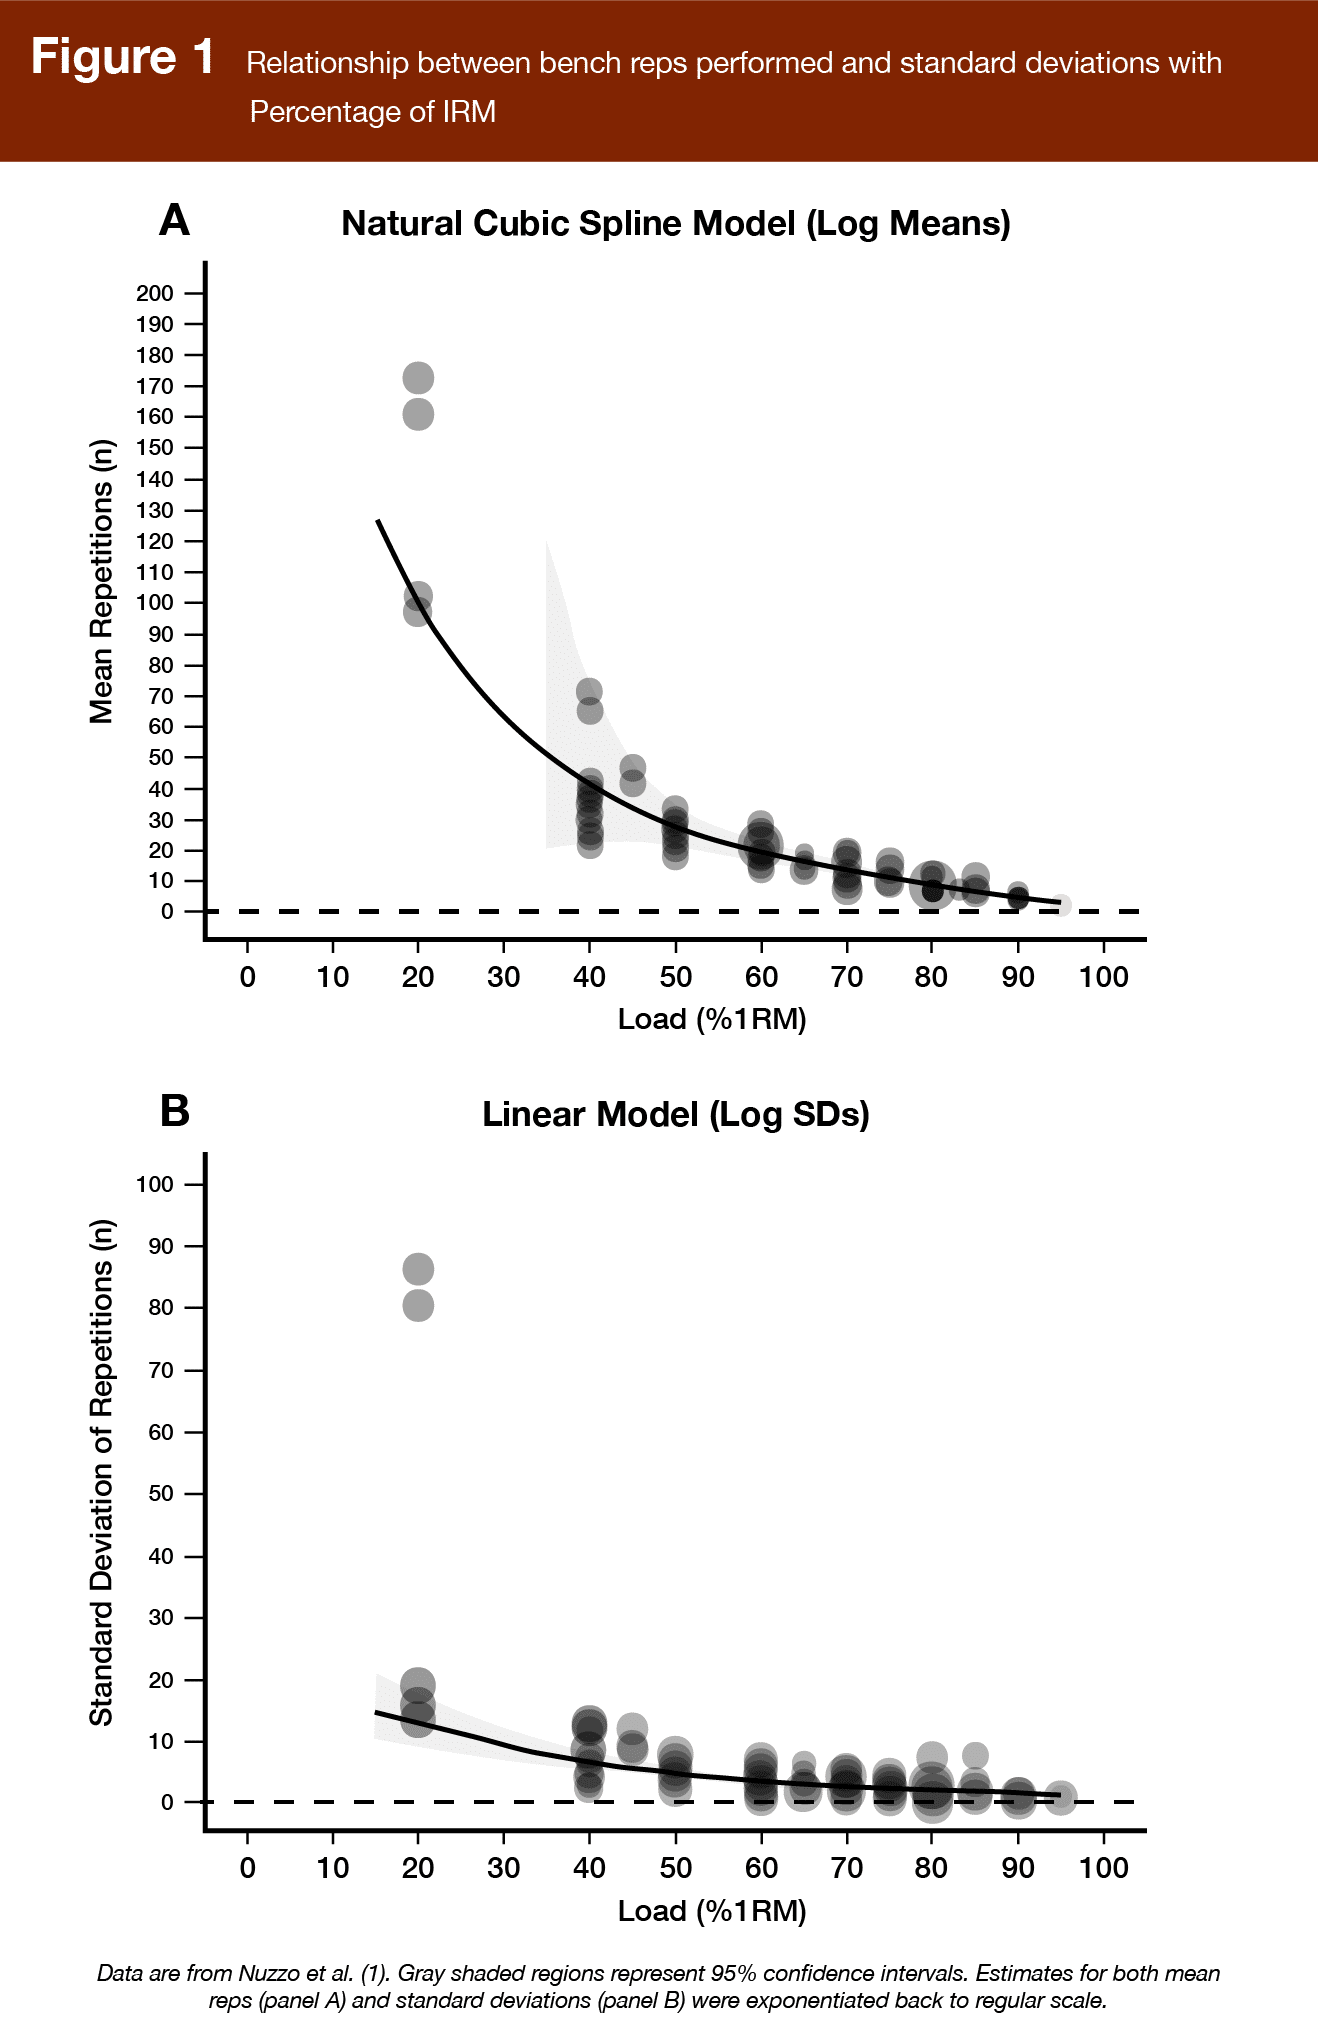
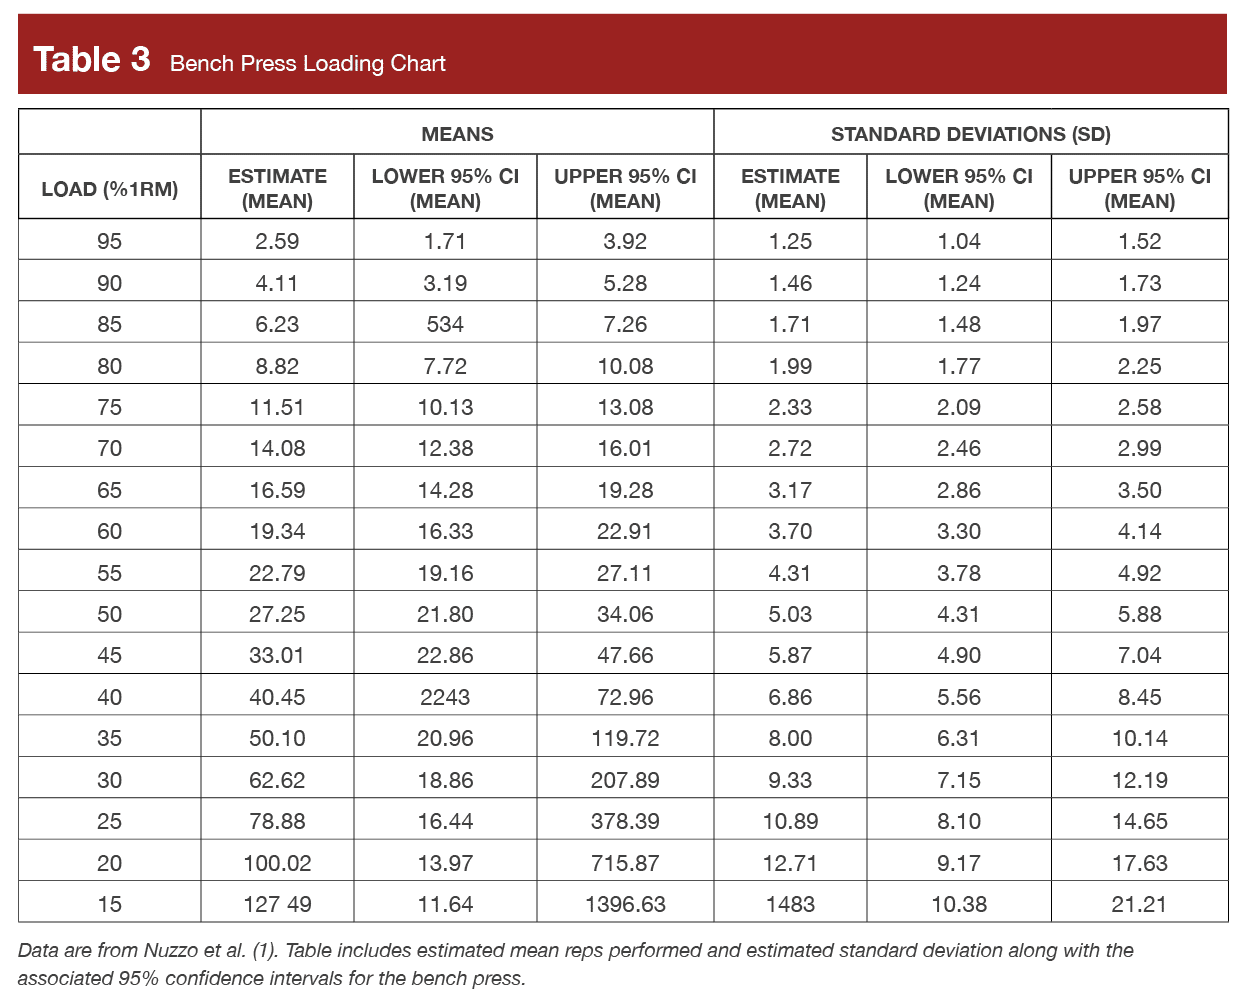
On average, individuals performed fewer repetitions at the same percentage of 1RM on the bench press than on the leg press, and individual variation tended to be greater at lower percentages of 1RM. Additionally, the difference in reps performed was larger at each 5% of 1RM increment at lower loads than at higher loads. For example, the estimated mean difference in reps from 40% (40.45 reps) to 45% (33.01 reps) of 1RM was 7.44 reps compared to the difference from 80% (8.82) to 85% (6.23) of 1RM, which was 2.38 reps. Figure 1AB shows the log means (cubic spline model) and log standard deviations (linear model) for the bench press, and Table 3 shows the bench press loading chart with the estimated means.
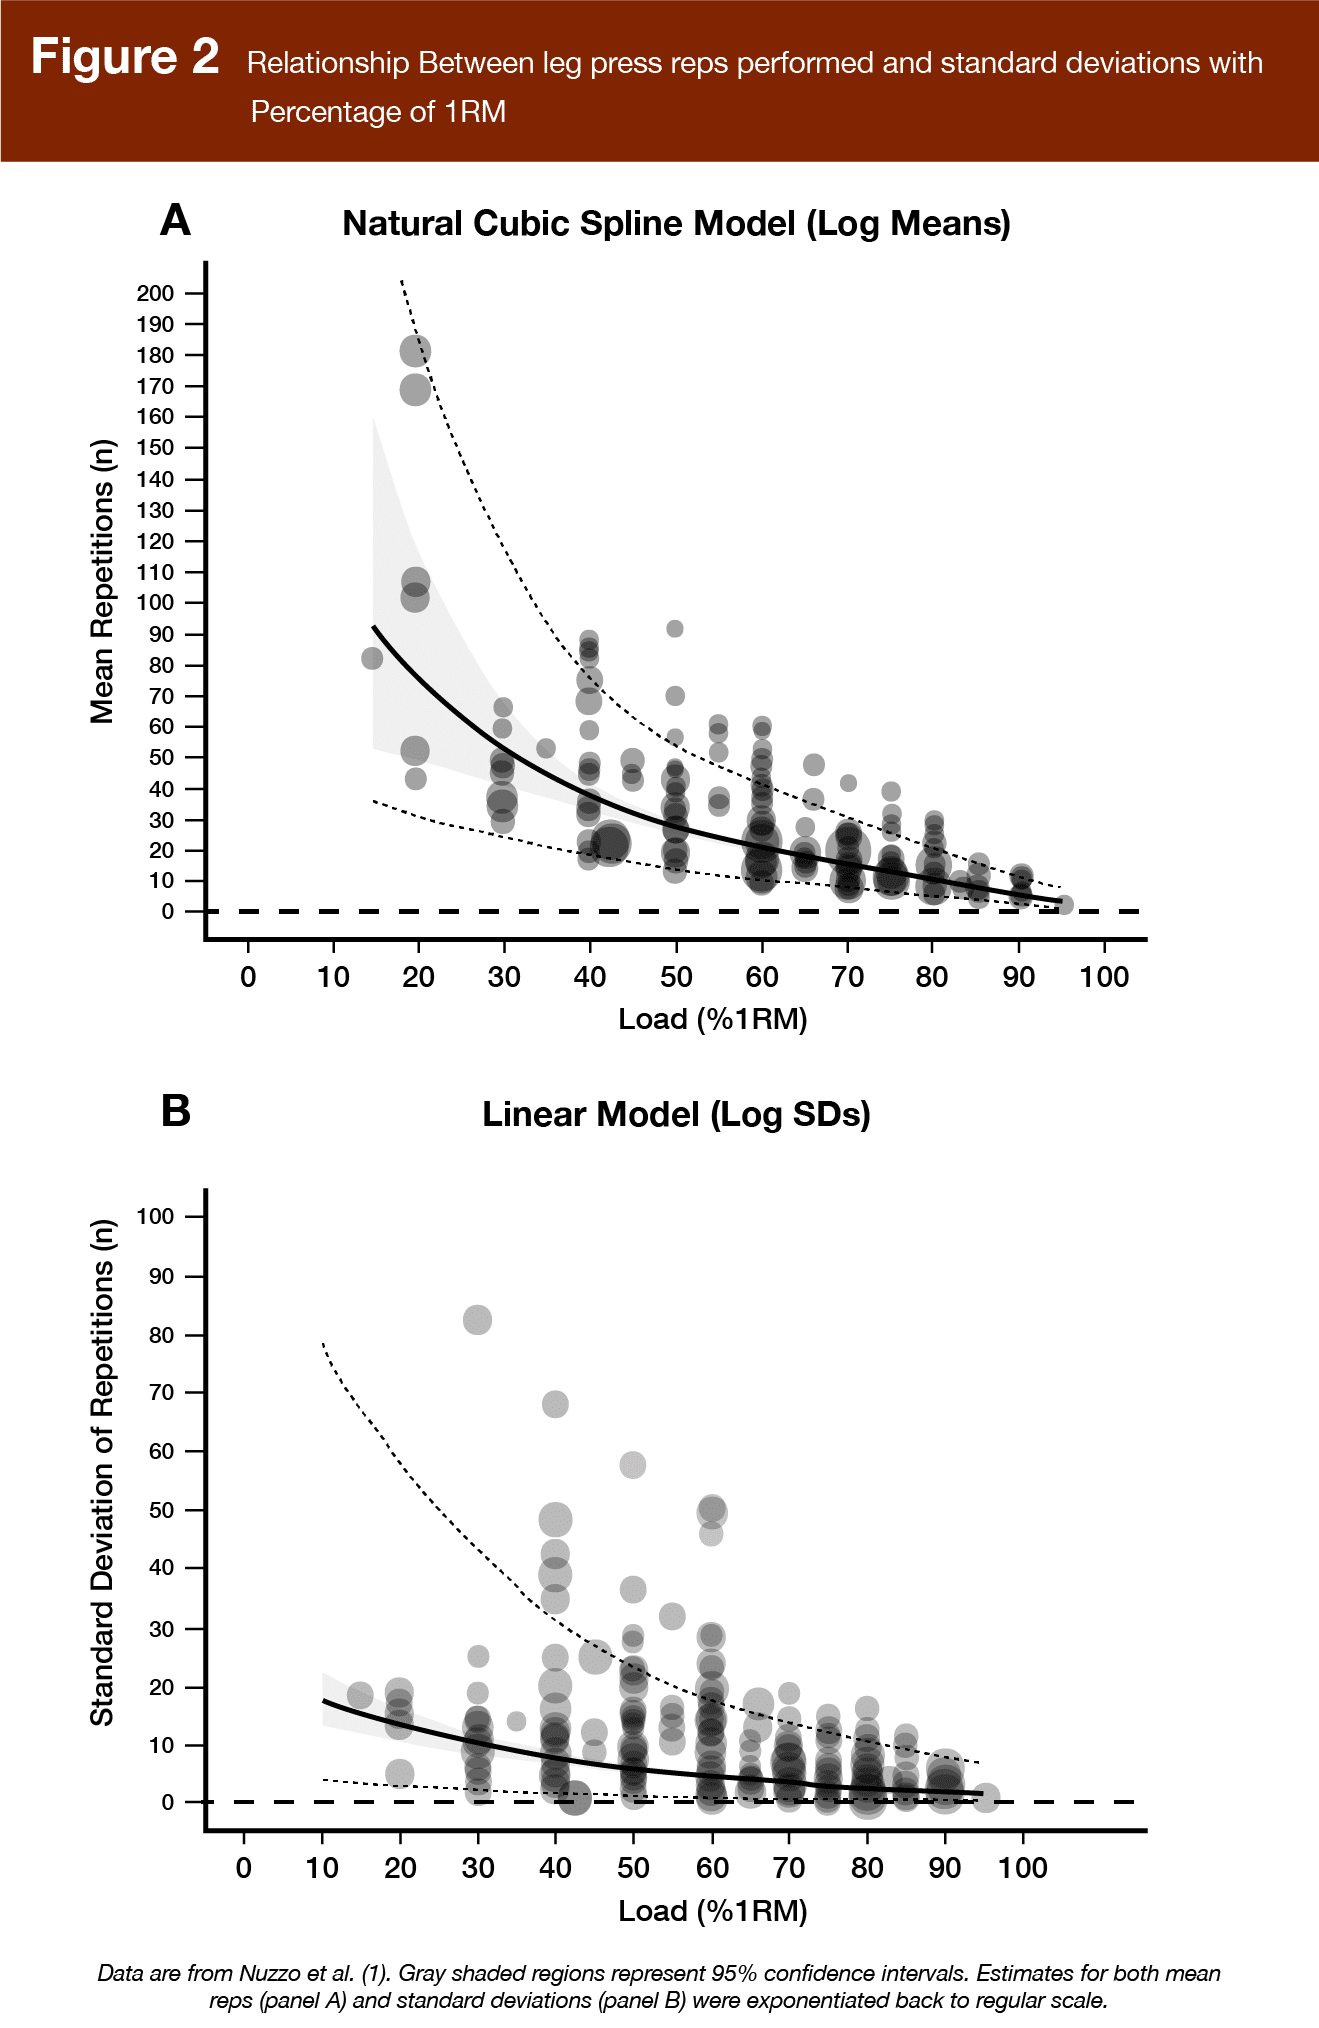
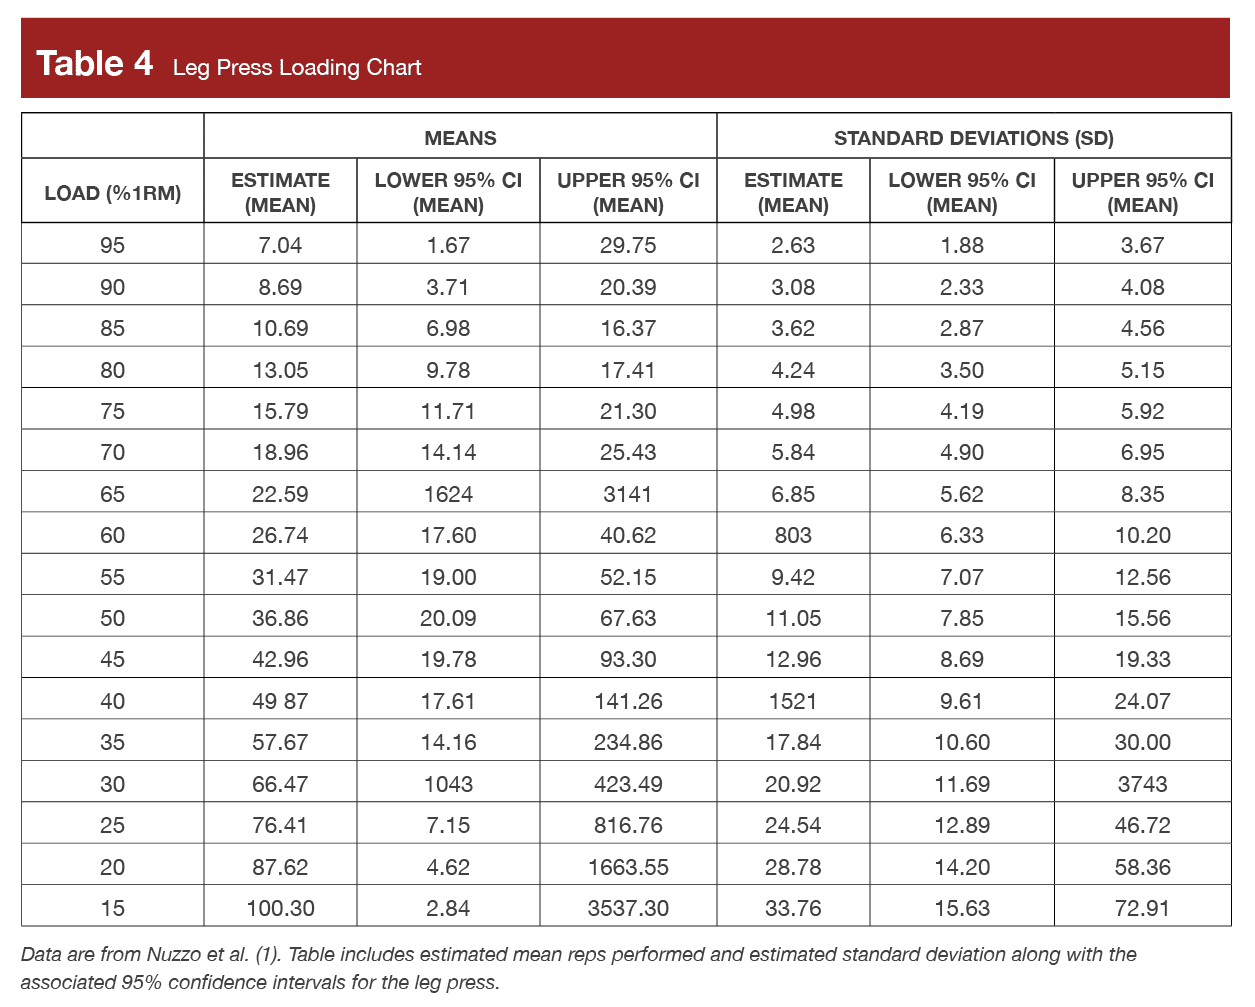
Leg Press Loading Chart
Individuals tended to perform more reps at a given percentage of 1RM on the leg press than on the bench press. For example, the estimated mean reps at 70% of 1RM on the leg press was 18.96 compared to 14.08 on the bench press. Similar to the bench press, individual variation tended to be greater at lower percentages of 1RM on the leg press, and the difference in reps performed was larger at each 5% of 1RM increment at lower loads than at higher loads. Figure 2AB shows the log means (cubic spline model) and long standard deviations (linear model) for the leg press, and Table 4 shows the leg press loading chart with estimated means.
Interpretation
There are few concepts more foundational to resistance training than understanding the number of reps that can be performed at a specific percentage of 1RM. With this in mind, it’s pretty wild that we’re just now updating a loading chart that was published in a textbook (8) about 30 years ago without robust scientific support. This chart is based on the results of two studies by Hoeger et al. (2, 3). Hoeger et al examined reps per performed at 40, 60, and 80% of 1RM in both untrained and trained women and men on the leg press, lat-pulldown, bench press, leg extension, sit-up, leg curl, and arm curl. Despite this study’s finding that reps to failure at specific percentages of 1RM were exercise-, sex-, and training status-specific, the commonly used loading chart (8) was put into practice with little explanation of how the values came about. Furthermore, the original loading chart did not reference the interindividual variation of reps performed (4, 5). Therefore, this Interpretation will examine the present findings, compare them to the original loading chart, and discuss whether loading charts and percentage-based training still have a place despite advancements in autoregulation.
Findings from Nuzzo et al. (1)
The simplest way to examine the present findings is to compare the newly created loading charts with the original loading chart from the early 1990s (8). Thus, Table 5 compares the difference between the original loading chart and the findings from Nuzzo et al (1) at every 5% increment from 65% to 100% of 1RM, with reps rounded to the nearest whole number.
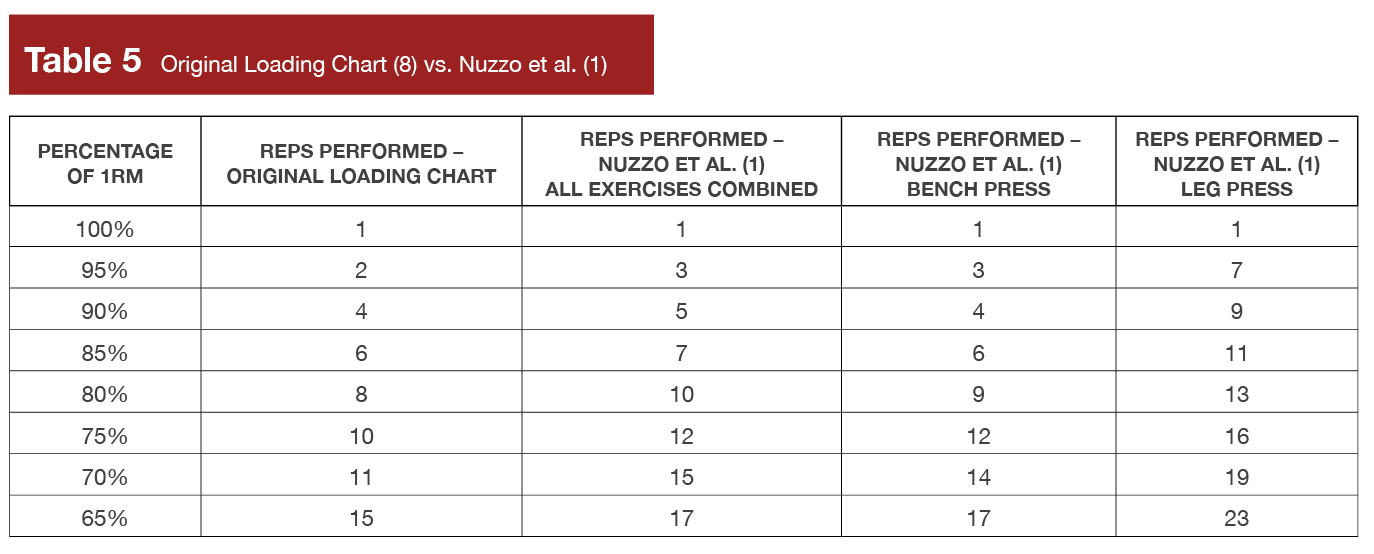
The side-by-side comparison shows that the reps allowed at a given percentage of 1RM for the leg press are considerably different from the all exercises and bench press tables. In practice, people sometimes use the original loading chart for squats and bench presses, but not for other exercises. This is a good practice, as the chart would be far too conservative to program for leg press. Although Nuzzo et al (1) noted that exercises other than the bench press and leg press would fit well with the all-exercises loading chart, I think this is because there wasn’t a large enough data set on any other exercise. For example, Hoeger et al (3) reported that, on the leg curl, trained women performed 5.3 ± 2.6 reps, while trained men performed 7.2 ± 3.1 reps at 80% of 1RM, and both values are considerably different than any value associated with 80% of 1RM in Table 4.
Another aspect that this meta-analysis could not fully flesh out was the potential difference in reps performed between free-weight and machine-based exercises. The researchers noted that reps from Smith machine squats were combined with reps from free-weight squats, and the same for the bench press because, “many papers did not include information on the equipment used, and of those papers that included such information, insufficient data were available to warrant exploration of separate REPS ~ %1RM relationships for Smith machine and barbell exercises.” Although this analysis couldn’t be conducted, there is some evidence that free-weight and Smith machine variations are, on average, associated with different numbers of reps performed. For instance, Rodriguez-Rosell et al (9 – MASS Review) found that trained men performed, on average, 9.6 squat reps at 70% of 1RM on the Smith machine squat, while Cooke et al (4) reported trained men completed 14 reps at 70% of 1RM on the free-weight squat. Moreover, Rodriguez-Rosell found that trained men performed, on average, 7.7 reps at 80% of 1RM on the Smith machine bench press (9) while Hoeger et al (3) reported trained men and women completed 12.2 reps at 80% of 1RM on the free-weight bench press. Thus, while a formal analysis of this topic would be ideal, it seems that lifters can perform more reps on a free-weight squat or bench press than on the Smith machine variant at a given percentage of 1RM.
Most importantly, the present findings highlight the high degree of interindividual variation in the number of reps performed. All three new loading charts demonstrate two things:1) there is a high degree of inter-individual variation in the reps performed, and 2) the variation increases as the relative load becomes lighter. The classic Hoeger et al data (3) used to construct the original loading chart also showed that inter-individual variation increased as the relative load decreased. For example, Hoeger et al. reported that trained women completed 22.4 ± 10.7, 57.3 ± 27.9, and 146.1 ± 66.9 reps on the leg press at 80, 60, and 40% of 1RM, respectively. Additionally, although Cooke et al (4) found that trained women and men completed 14 ± 4 reps to failure at 70% of 1RM on the squat, the range was 6 – 28. While 6 reps and 28 reps were the extremes in that study, throwing out each of those individual data points did not diminish the degree of interindividual variation much, as six individuals squatted ≥20 reps, while 11 lifters squatted ≤10 reps. It is crucial that coaches and lifters know the degree to which interindividual variation exists when using a loading chart for training prescription, but why it exists is still not well understood. The presently reviewed meta-analysis did not identify any factors that could meaningfully explain this relationship. Previous data (4) have identified body mass as potentially having an inverse relationship with the number of reps performed; however, that relationship was non-significant (p = 0.095). As I previously reviewed, Van Vossel et al (10) found that individuals with a greater proportion of type I muscle fibers tended to perform more reps than those with a greater proportion of type II fibers. However, the correlations between fiber type and reps reported by Van Vossel et al were not that strong (r ~ 0.40), making it difficult to use fiber type as a predictive tool for interindividual variation in rep performance. Additionally, even if fiber type was consistently predictive of rep performance, it is not a practical tool to use. Ultimately, the factors accounting for interindividual variation remain one of the most pressing questions in exercise science.
The Place For Percentage-Based Load Prescription
The limitations of percentage-based load prescriptions are obvious:
- They don’t account for interindividual variation
- They don’t account for day to day fluctuations in performance
- They’re usually based on charts that aren’t exercise-specific
- The loading charts are possibly wrong, even on the group level
I won’t spend a ton of time hashing out long-winded examples of each of the four points because they are pretty self-explanatory, so quick explanations should suffice. First, with such a large degree of inter-individual variation in rep performance, as confirmed by Nuzzo et al (1), programming based on a loading chart without individual considerations would lead to programming that is too difficult or too easy for many. As mentioned earlier, Cooke et al (4) found that many lifters squatted over 20 reps and others under 10 reps during a squat set to failure at 70% of 1RM. The original loading chart (8) calls for 12 reps at 70%, which is inappropriate for many. Second, if someone was able to perform the exact reps to failure specified by the loading chart (old or new chart) at a given percentage of 1RM that doesn’t take into account individual rates of fatigue from set to set, the loading chart does not indicate how many reps could be completed with the same load on subsequent sets. The fatigue rate is important because most programming consists of multi-set training. In addition, the loading chart doesn’t consider that performance can fluctuate day to day. Third, as demonstrated in the presently reviewed meta-analysis, loading charts should be exercise-specific, at least for some exercises. Programming the bench press based on a leg press chart would result in most people failing on the majority of their sets. Lastly, a loading chart can be incorrect on the group level. While we can feel much better about the newly created charts in Nuzzo et al (1), as more evidence has emerged, it seems that the original loading chart – which was based on real observations in a group of participants – was off in a broader sense in some cases (see side-by-side comparisons in Table 4).
Despite my bashing of loading charts up to this point, I still think loading charts and percentage-based prescriptions have a place in training. Sure, velocity-based training, and RIR-based training are advancements, but these prescription methods also have limitations. For example, velocity-based prescriptions are often not individualized, which is a similar flaw of loading charts. It is now well-known that the specific velocity associated with a specific percentage of 1RM or RIR is highly individual. Therefore, prescribing group-level velocity loss thresholds will lead to a different RIR between individuals. Further, prescribing loads based on a specific velocity will produce various relative intensities across individuals. For example, 0.70 m/s may be 70% of 1RM for some, but 77.5% for others.
An advantage of RIR-based training is that it is inherently individualized, unlike group-level loading charts and velocity prescriptions. However, the main limitation of RIR-based prescriptions is that the rating is subjective and prone to human error. While individuals can be very accurate (within 1 rep) when predicting RIR during low reps sets (<12 reps) and close to failure (within ~3 reps of failure), solely programming RIR presents some challenges. Namely, some people find RIR-based training cumbersome and would rather have a pre-planned prescription. Additionally, some lifters always undershoot RIR. In other words, some individuals almost always end up failing when instructed to terminate the set at 1 RIR, or maxing out when they are supposed to work up to a single at 1 – 2 RIR. In such cases, percentage-based or exact load prescriptions may be beneficial.
Autoregulation is beneficial much of the time, and some studies report that velocity-based (11) or RIR-based training (12) leads to greater increases in strength than percentage-based training. However, other studies have shown no significant difference between velocity- or RIR-based training and percentage prescription (13, 14, 15). One reason why percentage-based training might hold up reasonably well when compared to autoregulated training is that the percentage-based prescription in some studies has been fairly conservative, keeping lifters shy of failure, which is probably beneficial for strength gains (16). For example, in Dr. In Helms’s Ph.D. thesis, lifters trained the squat and bench for 3 × 8 at 72.5% of 1RM, which would be approximately 5 RIR using the bench press loading chart from the presently reviewed meta-analysis (1). Indeed, as Helms et al found that subjects rated sets, on average, mostly between 4 – 5 RIR in the percentage-based group with a wider range of 1-5 RIR in the RIR-based group. Therefore, while percentage-based training has flaws, it is still a viable option when used appropriately.
One of the ways to use percentage-based training appropriately, similar to velocity-based training, is to individualize it, and then reps can be programmed based on that lifter’s individual chart. To create an individual loading chart, a lifter can perform a set to failure at a moderate load (e.g., 70 – 80% of 1RM) and then predict the rest of the chart. Ideally, the individual would perform failure sets for at least a few loads on different exercises. Once those failure sets are performed, and preferably performed twice over multiple days for reliability, the rest of the individual chart can be extrapolated, for each exercise, using the slope between change in percentage of 1RM and change in reps from Nuzzo et al (1). Table 6 shows an individual’s hypothetical performance during sets to failure on the bench press and the extrapolated individualized loading chart.
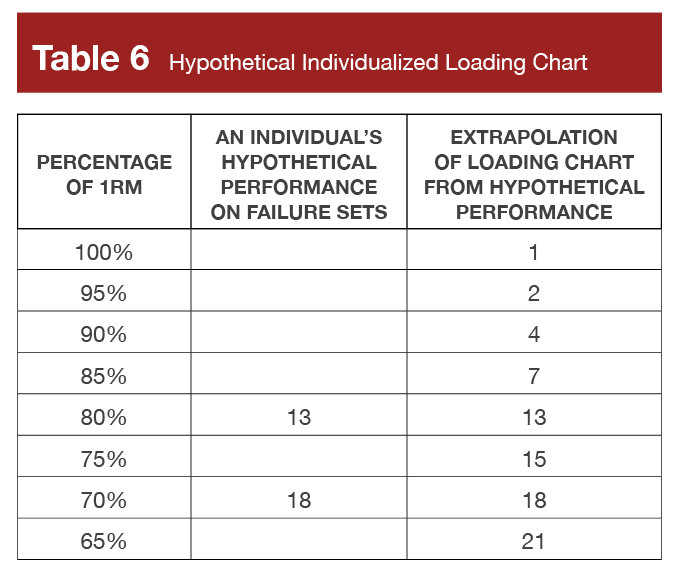
When creating an individualized loading chart, I recommend taking a rep or two off the number performed to failure. This is because the number of reps someone performs in a heightened state is not necessarily the number of reps they can perform on a day to day basis. For example, in Table 5, the individual performed 13 reps at 80% of 1RM; however, I would recommend using 11 to correspond to 80%. Furthermore, when using this chart to program multiple sets, I would probably program something like 3 × 8 at 80% of 1RM so that each set ends with a few RIR. Obviously, there is some extrapolation with individualized charts, and the chart may not be perfect; however, it is an improvement over population-level charts. Additionally, some individuals don’t have access to velocity and are not good at gauging RIR, making individual loading charts a practical option. Further, beginners without a coach need to start somewhere; and could utilize individualized loading charts. Personally, although I am an autoregulation proponent, I sometimes enjoy having a pre-planned session where I don’t have to think about anything other than hitting the numbers on the paper (or the screen). Furthermore, even when using individualized charts, a lifter can gauge the RIR after each set to inform load progression decisions.
Additional Thoughts
When there are newer tools such as autoregulation, we tend to view older tools as completely useless. Despite the flaws associated with loading charts, they are far from useless. A population-level chart can be useful for programming in a large team setting. Obviously, the loading chart is not accurate for everyone on the team, but it provides a general starting point. Similarly, a loading chart can provide a starting point for an individual, and then individual loading charts can be constructed.
A loading chart-adjacent strategy is to program exact loads. For example, if a coach or lifter knows that a lifter’s bench press 10RM is 100kg and they want to program multiple sets shy of failure, they could program 3 × 7 at their 10RM load and expect sets to land within 1 – 3 RIR, taking into account set to set fatigue. This strategy is very similar to creating an individual loading chart; it simply disregards the percentage of 1RM to which the exact load corresponds.
Overall, various load prescription strategies are valid, and you don’t have to use only one. The appropriate strategy (or strategies) is one that the lifter has access to (if equipment is needed), fits their personality, and that they will adhere to and enjoy long term.
Next Steps
There are three ways in which this line of research can proceed. First, research groups can begin diligently reporting the number of reps associated with the percentage of 1RM in various exercises. Thus, it can be clearly delineated if more exercise-specific loading charts are required. Second, longitudinal research could be conducted using the newly constructed charts from Nuzzo et al to determine their efficacy. Lastly, researchers can individualize loading charts and longitudinally compare individualized loading chart prescriptions to autoregulated (velocity or RIR) training to examine how well my theory that individualized charts are a notable improvement holds up.
Application and Takeaways
The presently reviewed meta-analysis from Nuzzo et al (1) provided an important update to loading charts. It provides new loading charts and illustrates that reps performed at a given percentage of 1RM is exercise-specific and highly individual. Advancements in autoregulation seemingly relegated percentage-based prescriptions to second-tier status; however, percentages based on accurate loading charts still provide a decent starting point for large team settings and beginners. Moreover, some lifters may prefer percentage-based over autoregulated training. In that case, loading charts should be individualized so that the percentage prescription is as accurate as possible. Ultimately, coaches and lifters should both be comfortable with the load prescription method they use, and that method should be something that lifters will adhere to over the long term.
Get more articles like this
This article was the cover story for the December 2023 issue of MASS Research Review. If you’d like to read the full, 97-page issue (and dive into the MASS archives), you can subscribe to MASS here.
Subscribers get a new edition of MASS each month. Each issue includes research review articles, video presentations, and audio summaries. PDF issues are usually around 100 pages long.
References
- Nuzzo JL, Pinto MD, Nosaka K, Steele J. Maximal number of repetitions at percentages of the one repetition maximum: A meta-regression and moderator analysis of sex, age, training status, and exercise. Sports Medicine. 2023 Oct 4:1-9.
- Hoeger WWK, Barette SL, Hale DF, Hopkins DR. Relationship between repetitions and selected percentages of one repetition maximum. J Appl Sport Sci Res. 1987;2(1):11–3.
- Hoeger WWK, Hopkins DR, Barette SL, Hale DF. Relationship between repetitions and selected percentages of one repetition maximum: a comparison between untrained and trained males and females. J Appl Sport Sci Res. 1990;4(2):47–54.
- Cooke DM, Haischer MH, Carzoli JP, Bazyler CD, Johnson TK, Varieur R, Zoeller RF, Whitehurst M, Zourdos MC. Body mass and femur length are inversely related to repetitions performed in the back squat in well-trained lifters. The Journal of Strength & Conditioning Research. 2019 Mar 1;33(3):890-5.
- Shimano T, Kraemer WJ, Spiering BA, Volek JS, Hatfield DL, Silvestre R, Vingren JL, Fragala MS, Maresh CM, Fleck SJ, Newton RU. Relationship between the number of repetitions and selected percentages of one repetition maximum in free weight exercises in trained and untrained men. The Journal of Strength & Conditioning Research. 2006 Nov 1;20(4):819-23.
- Zourdos MC, Klemp A, Dolan C, Quiles JM, Schau KA, Jo E, Helms E, Esgro B, Duncan S, Merino SG, Blanco R. Novel resistance training–specific rating of perceived exertion scale measuring repetitions in reserve. The Journal of Strength & Conditioning Research. 2016 Jan 1;30(1):267-75.
- Guerriero A, Varalda C, Piacentini MF. The role of velocity based training in the strength periodization for modern athletes. Journal of Functional Morphology and Kinesiology. 2018 Nov 16;3(4):55.
- Baechle TR, Earle RW, editors. Essentials of strength training and conditioning. Human kinetics; 2008.
- Rodríguez-Rosell D, Yáñez-García JM, Sánchez-Medina L, Mora-Custodio R, González-Badillo JJ. Relationship between velocity loss and repetitions in reserve in the bench press and back squat exercises. The Journal of Strength & Conditioning Research. 2020 Sep 1;34(9):2537-47.
- Van Vossel K, Hardeel J, Van de Casteele F, de Jager S, Lievens E, Boone J, Derave W. Muscle typology influences the number of repetitions to failure during resistance training. European Journal of Sport Science. 2023 May 13:1-0.
- Dorrell HF, Smith MF, Gee TI. Comparison of velocity-based and traditional percentage-based loading methods on maximal strength and power adaptations. The Journal of Strength & Conditioning Research. 2020 Jan 1;34(1):46-53.
- Graham T, Cleather DJ. Autoregulation by “repetitions in reserve” leads to greater improvements in strength over a 12-week training program than fixed loading. The Journal of Strength & Conditioning Research. 2021 Sep 1;35(9):2451-6.
- Banyard HG, Tufano JJ, Weakley JJ, Wu S, Jukic I, Nosaka K. Superior changes in jump, sprint, and change-of-direction performance but not maximal strength following 6 weeks of velocity-based training compared with 1-repetition-maximum percentage-based training. International journal of sports physiology and performance. 2020 Sep 1;16(2):232-42.
- Orange ST, Metcalfe JW, Robinson A, Applegarth MJ, Liefeith A. Effects of in-season velocity-versus percentage-based training in academy rugby league players. International journal of sports physiology and performance. 2019 Oct 30;15(4):554-61.
- Helms ER, Byrnes RK, Cooke DM, Haischer MH, Carzoli JP, Johnson TK, Cross MR, Cronin JB, Storey AG, Zourdos MC. RPE vs. percentage 1RM loading in periodized programs matched for sets and repetitions. Frontiers in physiology. 2018 Mar 21;9:247.
- Carroll KM, Bernards JR, Bazyler CD, Taber CB, Stuart CA, DeWeese BH, Sato K, Stone MH. Divergent performance outcomes following resistance training using repetition maximums or relative intensity. International journal of sports physiology and performance. 2019 Jan 1;14(1):46-54.