
This is an article I meant to write a while back when this article on Precision Nutrition about nutrition labels was first making the rounds, but I never got around to it.
Let me start by saying that I really like PN, I respect what they do, and I have a load of respect for John Berardi’s work. However, I think this article misses the mark for some pretty straightforward reasons that are easy to demonstrate mathematically. First off, I’d strongly recommend you read the article. I do think it raises some good points, and it did a great job of raising awareness about an issue most people aren’t familiar with: the information on nutrition labels isn’t perfectly accurate (in fact, the law allows it to be off by up to 20%) and can – at times – be wildly inaccurate. The foods may come packaged with more calories or fewer calories than are on the label, and your body does a better or worse job of extracting the energy from certain foods (largely based on fiber content and how it’s prepared).
However, I think the article misses the mark when it makes the leap to claim that “counting calories as a way to try to know, and control, your energy intake is fundamentally — sometimes hopelessly — flawed.”
How I’ll address this issue
The PN article does a very good job demonstrating that for every discrete thing you put in your mouth, the listed nutrition information can be way off. However, the question at hand is whether the logical implication is that counting calories as a way to know and control your energy intake is flawed. Therefore, I’ll be looking at the effect of variations in “true” calorie counts from “listed” calorie counts on average energy consumed over longer periods of time (i.e. time scales required for meaningful changes in weight or body composition to occur).
For starters, I’ll just consider a single food that claims on its label to have 500kcal, set up some parameters to have the “actual” calorie content of that food vary from that number, and when the effects of different levels of variation essentially become meaningless (here, I’ll define a “meaningless” level of error to be 3% or less. When you think you’re eating 500kcal but you’re really eating 485 or 515, that’s really not going to make a difference).
Next, I’ll consider the effects of variations in “true” calorie content within the context of a single day of eating. The labeling errors on individual foods may be large, but does that mean that the error within an entire day of eating will be large?
Next, I’ll see whether those errors grow or shrink over time with multiple days of eating.
Finally, I’ll briefly discuss other possible issues. Specifically, I’ll focus on the possibility that errors in calorie labeling may consistently skew in one direction or another instead of being evenly distributed, and discuss the relevance of that potential problem in the context of accuracy versus precision.
Errors within a single food
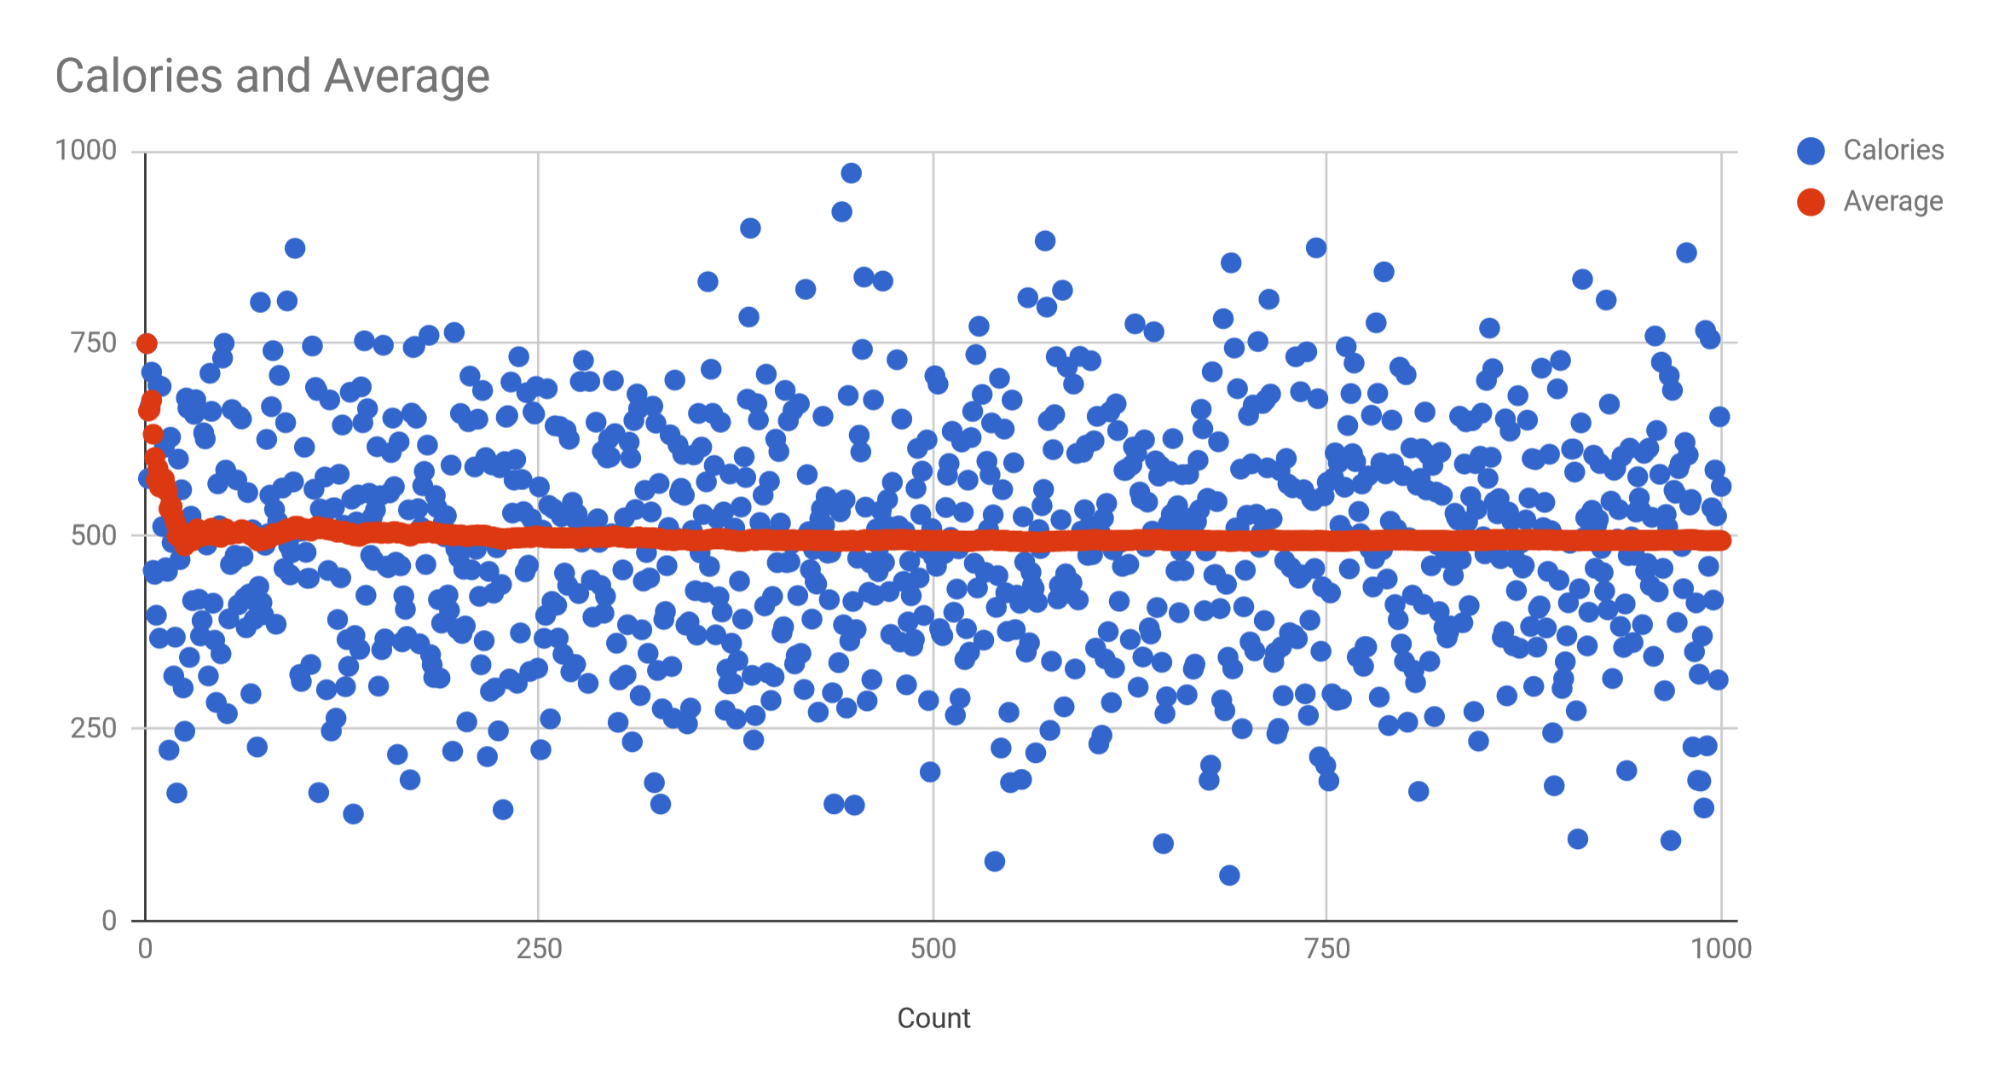
This is the simplest way to model the effects of variability in “true” calorie counts versus listed calorie counts. Here, I just used some simple spreadsheet functions to simulate 1,000 versions of the same food that’s listed to have 500 calories. To do this, you can just go =norminv(rand(), mean, standard deviation), and drag this formula down for as many cells as you want. For each test, the mean was 500. I plugged in different standard deviations, ranging from 50 to 150.
To contextualize these numbers a bit, with a standard deviation of 50 calories, some errors exceeded 35%, most absolute errors were below 20% (i.e. the level of accuracy required by law), and the average absolute error was 7-8.5%. With a standard deviation of 100 calories, some errors exceeded 70%, most absolute errors were below 40% (2x the leniency of the law), and the average absolute error was 15.5-17%. With a standard deviation of 150 calories, some errors exceeded 120% (i.e. a food labeled as 500 calories had 1,000+ calories or negative calories), most absolute errors were below 90%, and the average absolute error was 23-26% (i.e. the average error exceeded the maximum legal error).
Obviously, the mean error for every test collapsed toward 0. That’s to be expected, since I defined the distribution to have a mean of 500. However, it’s more important to focus on the point at which average errors reach triviality. I’m defining triviality as 3% or less, meaning that when you eat foods that are labeled as having 500 calories, the average amount you’re eating is somewhere between 485 and 515 calories.
For 10 simulations with a standard deviation of 50 calories, it took 15, 6, 8, 13, 15, 2, 32, 7, 12, and 0 instances for the average error to dip below and stay below 3%. With a standard deviation of 100 calories, it took 26, 18, 58, 14, 83, 68, 191, 62, 131, and 13 instances for the average error to dip below and stay below 3%. With a standard deviation of 150 calories, it took 278, 237, 94, 64, 68, 107, 60, 503, 130, and 123 instances for the average error to dip below and stay below 3%.

Now, these numbers are somewhat arbitrary, based on what you consider a “trivial” difference to be. I picked 3% to be very conservative, but if you went with 5% (i.e. for things labeled 500 calories, you’re actually consuming somewhere between 475 and 525 calories, on average; still a very small difference), it would take substantially fewer instances. On the flip side, if you were a huge stickler and went with 1% as your threshold of acceptable error (which is pretty ridiculous), even with a standard deviation of 150 calories, where your average absolute error is ~23-26%, only one out of 40 trials I ran wasn’t well below that threshold by 1,000 trials.
Personally, I think the assumption of a standard deviation of 50 calories is the most likely of the three scenarios in the real world (most foods are labeled with numbers within the legal limit of 20%), though one could make an argument for the standard deviation of 100 calories (since cooking conditions and digestive quirks introduce even more volatility). Both of those conditions reached trivial error within a manageably small number of instances. Even the ridiculous scenario assuming a standard deviation of 150 calories did adequately well, assuming you’re tracking calorie intake to manage long-term weight changes.
However, this whole analysis is quite simplistic. After all, it’s just assuming all foods are 500 calories. What happens when we apply this type of analysis to real-world dietary data?
Actual food data
My friend Daniel Lopez sent me a representative day of his MyFitnessPal data (Daniel wrote a much less technical and more reader-friendly version of this article as well, which you should read). I used his data because I have an extremely boring and non-representative diet, and he’s the person who reminded me of this topic.
Here’s his day of eating:
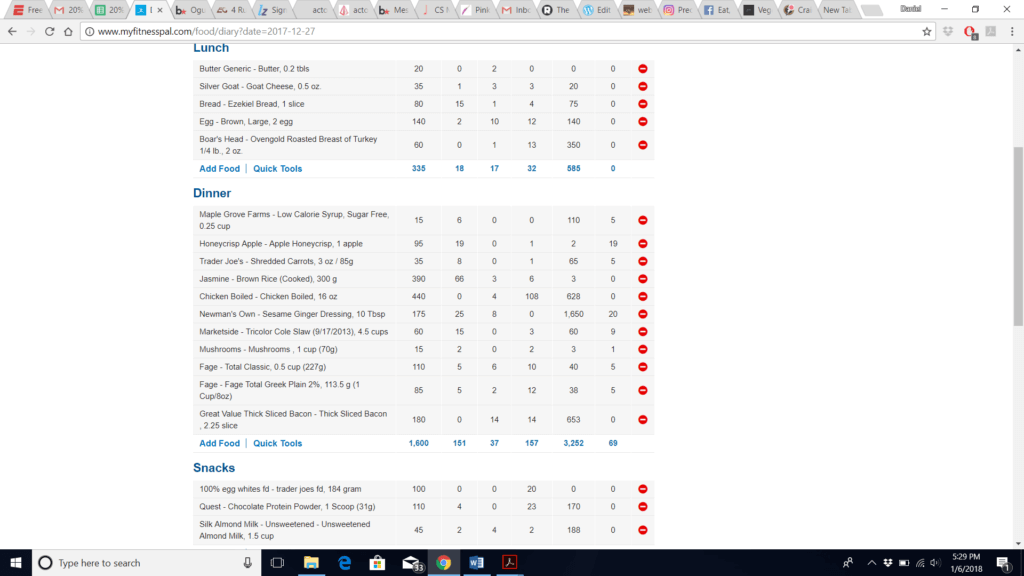
So, I applied the same sort of analysis to this full day of eating that amounted to 2,180 calories. I assumed the actual caloric content of each food from its listed value with a standard deviation of either 10% (same as the 50 calories SD above) or 20% (same as the 100 calories SD above). I wanted to see
- How innacurate was the average day of calorie tracking
- How innacurate was a whole month of calorie tracking
With an assumption that the average standard deviation of error was 10%, the worst day over the course of an entire month was off by 7.9% (172 calories), while the average error was 1% (22 calories), and the average absolute error was only about 2.7% (59 calories). Eating about 1% more calories than you thought you were eating, when assuming a pretty realistic amount of labeling error, doesn’t seem too bad to me.
With an assumption that the average standard deviation of error was 20%, the worst day over the course of an entire month was off by 16.2% (353 calories), while the average error was 0.7% (17 calories), and the average absolute error was only about 4.6% (100 calories).
Here’s the month of simulated days assuming an SD of 20%. As you’ll see, none of the individual days are that off, and tracking still works impeccably over an entire month:
| 20% SD | ||
| Day | Calories | Absolute Error |
| 1 | 2013 | 7.66% |
| 2 | 2088 | 4.22% |
| 3 | 2006 | 7.98% |
| 4 | 2228 | 2.20% |
| 5 | 2017 | 7.48% |
| 6 | 2073 | 4.91% |
| 7 | 2196 | 0.73% |
| 8 | 2110 | 3.21% |
| 9 | 2156 | 1.10% |
| 10 | 2079 | 4.63% |
| 11 | 1923 | 11.79% |
| 12 | 2533 | 16.19% |
| 13 | 2060 | 5.50% |
| 14 | 2371 | 8.76% |
| 15 | 2173 | 0.32% |
| 16 | 2268 | 4.04% |
| 17 | 2240 | 2.75% |
| 18 | 2060 | 5.50% |
| 19 | 2159 | 0.96% |
| 20 | 2143 | 1.70% |
| 21 | 2139 | 1.88% |
| 22 | 2337 | 7.20% |
| 23 | 2372 | 8.81% |
| 24 | 2069 | 5.09% |
| 25 | 2221 | 1.88% |
| 26 | 2285 | 4.82% |
| 27 | 2070 | 5.05% |
| 28 | 2176 | 0.18% |
| 29 | 2189 | 0.41% |
| 30 | 2143 | 1.70% |
| Average calories | 2163.23 | |
| Average error | -0.77% | |
| Average absolute error | 4.62% | |
| Maximum absolute error | 16.19% | |
This tells us three things:
1) Even when accounting for labeling error in all of the foods eaten, the whole-day calorie number you log will probably be within 3-5% of the “true” figure, on average.
2) Some days, the errors will be bigger, but almost always smaller than the average error per food. In other words, if you hear “food labels can be off by up to 20%,” the actual error in a whole day of tracking will almost always be far smaller. This is because positive errors in some foods will tend to be canceled out by negative errors in others.
3) Over the course of a month, the daily errors and per-food errors cancel out almost entirely.
Consistent directional errors
An astute reader may counter the article and ask, “What about if the errors mostly go in the same direction?” That would be a fair question, since we may assume that food manufacturers may have incentive to skew their calorie counts low to seem healthier, or to skew them high to seem more indulgent.
There are three potential scenarios here:
1) You eat a mix of foods that consistently skew up, and consistently skew down.
Ultimately, all that does is introduce more net variability (i.e. the SD may be closer to 20% instead of 10%), which makes things a bit noisier, but most of that noise will cancel out.
2) You eat a mix of foods that consistently skew in one direction or another.
Here, we need to discuss the importance of precision over accuracy. Accuracy, in this case, is the degree to which the average actual number of calories in what you eat matches the average listed number of calories in what you eat. Precision is the degree to which the actual number of calories in what you eat changes each time you eat a food. High precision (low variability) is good.
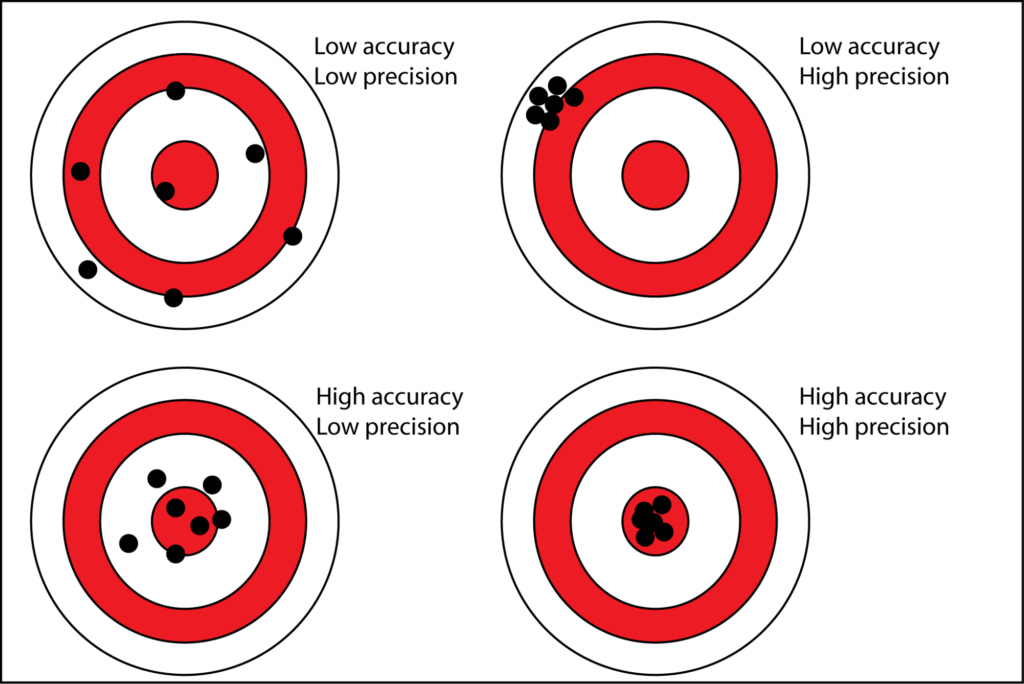
(source)
Imagine you have a pretty consistent meal schedule, and you eat the same breakfast and lunch every day. Let’s say you think you’re eating 500 calories in your breakfast, but it’s actually 600 calories, and let’s say you think you’re eating 800 calories in your lunch, but it’s actually 1,000 calories. You’re off by 300 calories per day, 2,100 calories per week, and 9,000 calories per month! However, you’re off by the same 300 calories per day, meaning that your accuracy is poor, but your precision is very good. If think you’re maintaining weight on 2,500 calories per day, and that you need to drop to 2000 to lose weight, your inaccuracy doesn’t matter. In reality, you’re maintaining weight on 2,800 calories per day, and you need to drop to 2,300 to lose weight. The actual calorie manipulation to affect weight change is the same. Your calorie counts are wrong, but that wrongness doesn’t limit their utility for knowing what you need to do to gain or lose weight, since they’re all wrong in the same direction.
3) You eat a mix of foods that consistently skew in one direction, and then change to an entirely different mix of foods that skews in the other direction.
This is the only case in which labeling errors would actually matter, and it’s a fringe case. Let’s assume you think you’re eating 2,500 calories per day to maintain weight, but all of the foods you’re eating consistently skew low, so you’re actually eating just 2,200 calories per day. Then, you drop your calories to 2,000 to lose weight, and while doing so, you change your daily diet to an entirely different set of foods that consistently skew high, so you’re actually still eating 2,200 calories.
That would be a problem in theory, but that’s just not how most people behave in practice. Furthermore, you could still adjust for this difference. You might think that you’re experiencing considerable metabolic adaptation, and needing to drop to 1500 calories to lose weight, when in reality, dropping to a target of 1500 calories results in an actual intake of 1700 calories. So, this might cause a bit of confusion (you think your energy intake decreased by 1000 calories per day – from 2500 to 1500 – when it actually decreased by 500 calories per day – 2200 to 1700) and short-term frustration, but it’s still not a significant barrier to long-term progress.
TL;DR
Yes, nutrition labels have errors. The errors on individual foods are sometimes (often, perhaps) much larger than people assume. However, unless those errors all skew in one direction, your daily calorie counts will still be quite accurate and precise, and their average accuracy will increase over time. If those errors do all skew in one direction, your calorie counts will be less accurate, but they’ll probably be more precise (which, ultimately, is more useful anyway). In all but one fringe case, knowing about the labeling error on foods is fun trivia, but doesn’t actually affect the utility of tracking calorie intake in the real world.
Read Next
- Training and Diet are Simple Because Your Body is Complex
- Perfecting Protein Intake in Athletes: How Much, What, and When? (and Beyond)