

If you asked most gymgoers to list the supplements that actually help build muscle, you can be confident that creatine would be on almost everyone’s list, and for good reason. In fact, a 2022 study found that creatine was the most popular supplement among male bodybuilders. Dozens of supplements claim to help you build muscle, but very few are supported by more than one or two longitudinal studies.
Creatine has held a well-deserved spot on the list of effective supplements ever since 2003, when Dr. J. David Branch published an absolute monster of a meta-analysis summarizing the creatine literature to that point. It included 100 studies in total, with 33 of those studies assessing the impact of creatine on measures of lean body mass. This meta-analysis found that creatine had a small (ES = 0.33) but significant effect on lean body mass.
That’s basically been the lay of the land ever since. There’s certainly been more research on creatine supplementation, and there have even been a handful of newer meta-analyses summarizing the impact of creatine supplementation on specific outcomes or in specific populations. But, Branch’s 20-year-old meta-analysis is still the paper that everyone cites to support creatine’s effectiveness at increasing muscle growth.
However, astute readers may have noticed an issue with the last couple of paragraphs. Branch’s meta-analysis looked at the effects of creatine supplementation on lean body mass, but lean body mass and muscle mass aren’t identical. Lean body mass also includes water, and creatine is known to cause some degree of fluid retention. So, a skeptical reader might (rightfully) note that Branch’s meta-analysis suggests that creatine increases muscle growth (since muscle is certainly a major component of lean body mass), but it only provides indirect evidence for that claim.
To directly assess the impact of creatine on muscle growth, you need studies that directly assess muscle growth. So, instead of studies measuring lean body mass (which might just reflect changes in fluid retention), you’d need to look for studies measuring muscle thickness or cross-sectional area.
Surprisingly, there were no studies directly assessing the impact of creatine on muscle growth when Branch published his meta-analysis, and there haven’t been a ton of studies on the topic in the intervening years. However, we now have enough studies on the topic to warrant a meta-analysis, which Burke and colleagues completed earlier this year.
The researchers identified all of the studies meeting these criteria:
- The studies needed to compare resistance training without creatine vs. resistance training with supplemental creatine. Furthermore, the resistance training intervention needed to last at least six weeks.
- The studies needed to be conducted on healthy adult subjects.
- The studies needed to be published in English-language, peer-reviewed journals.
- The studies needed to directly assess muscle size pre- and post-training using methods like ultrasound, computed tomography (CT), or magnetic resonance imaging (MRI).
- The studies couldn’t provide subjects with additional potentially anabolic ingredients (i.e., they needed to test the effects of creatine in isolation, not as a part of a multi-ingredient supplement).
Ultimately, 11 studies met these inclusion criteria, and were included in the meta-analysis.
Just to skip to the headline finding, creatine supplementation generally increased muscle growth, but the pooled effect size was (seemingly) tiny: ES = 0.11. You’d typically categorize that as a “trivial” effect.
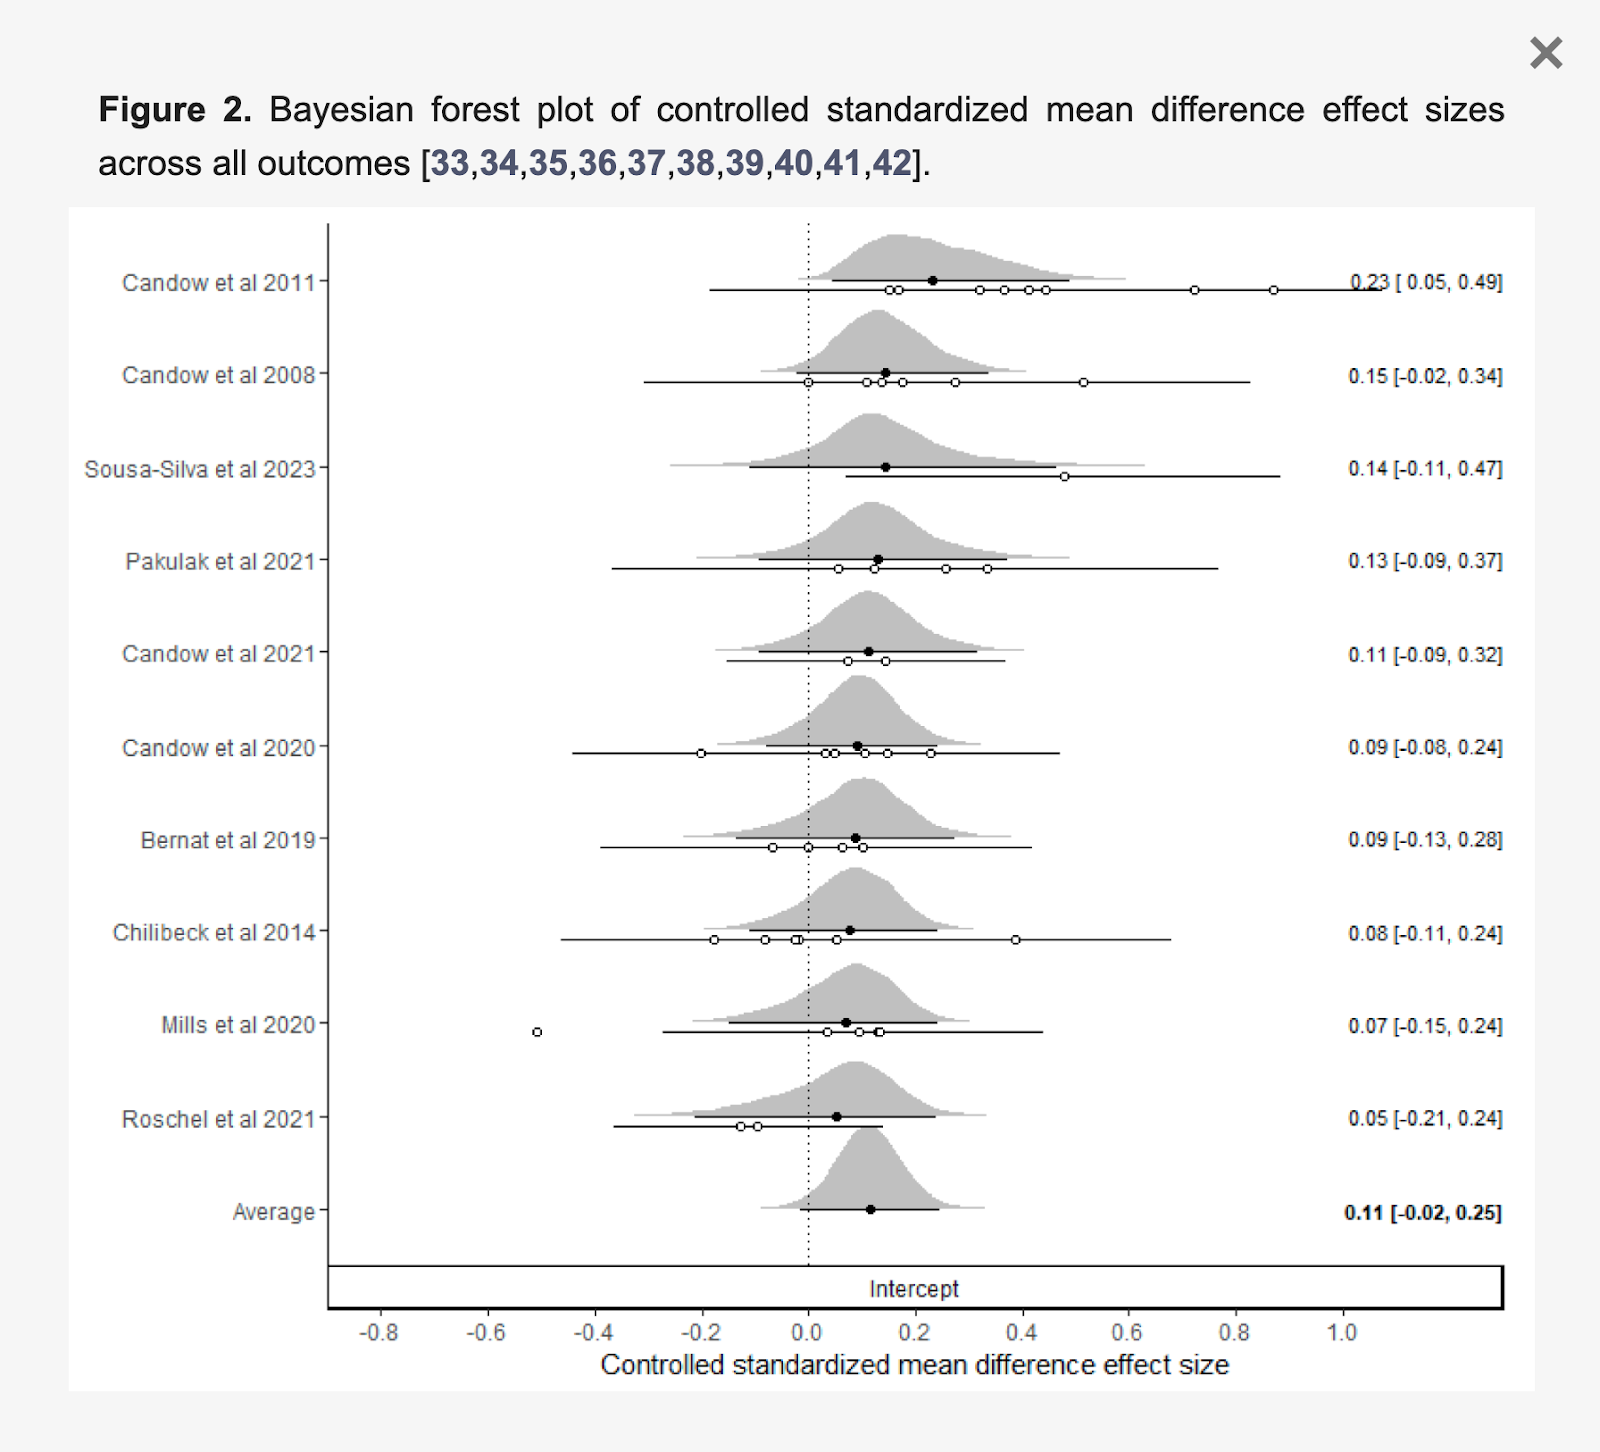
The overall magnitude of the effect was similar for all muscles assessed: the elbow flexors, elbow extensors, knee flexors, and knee extensors.


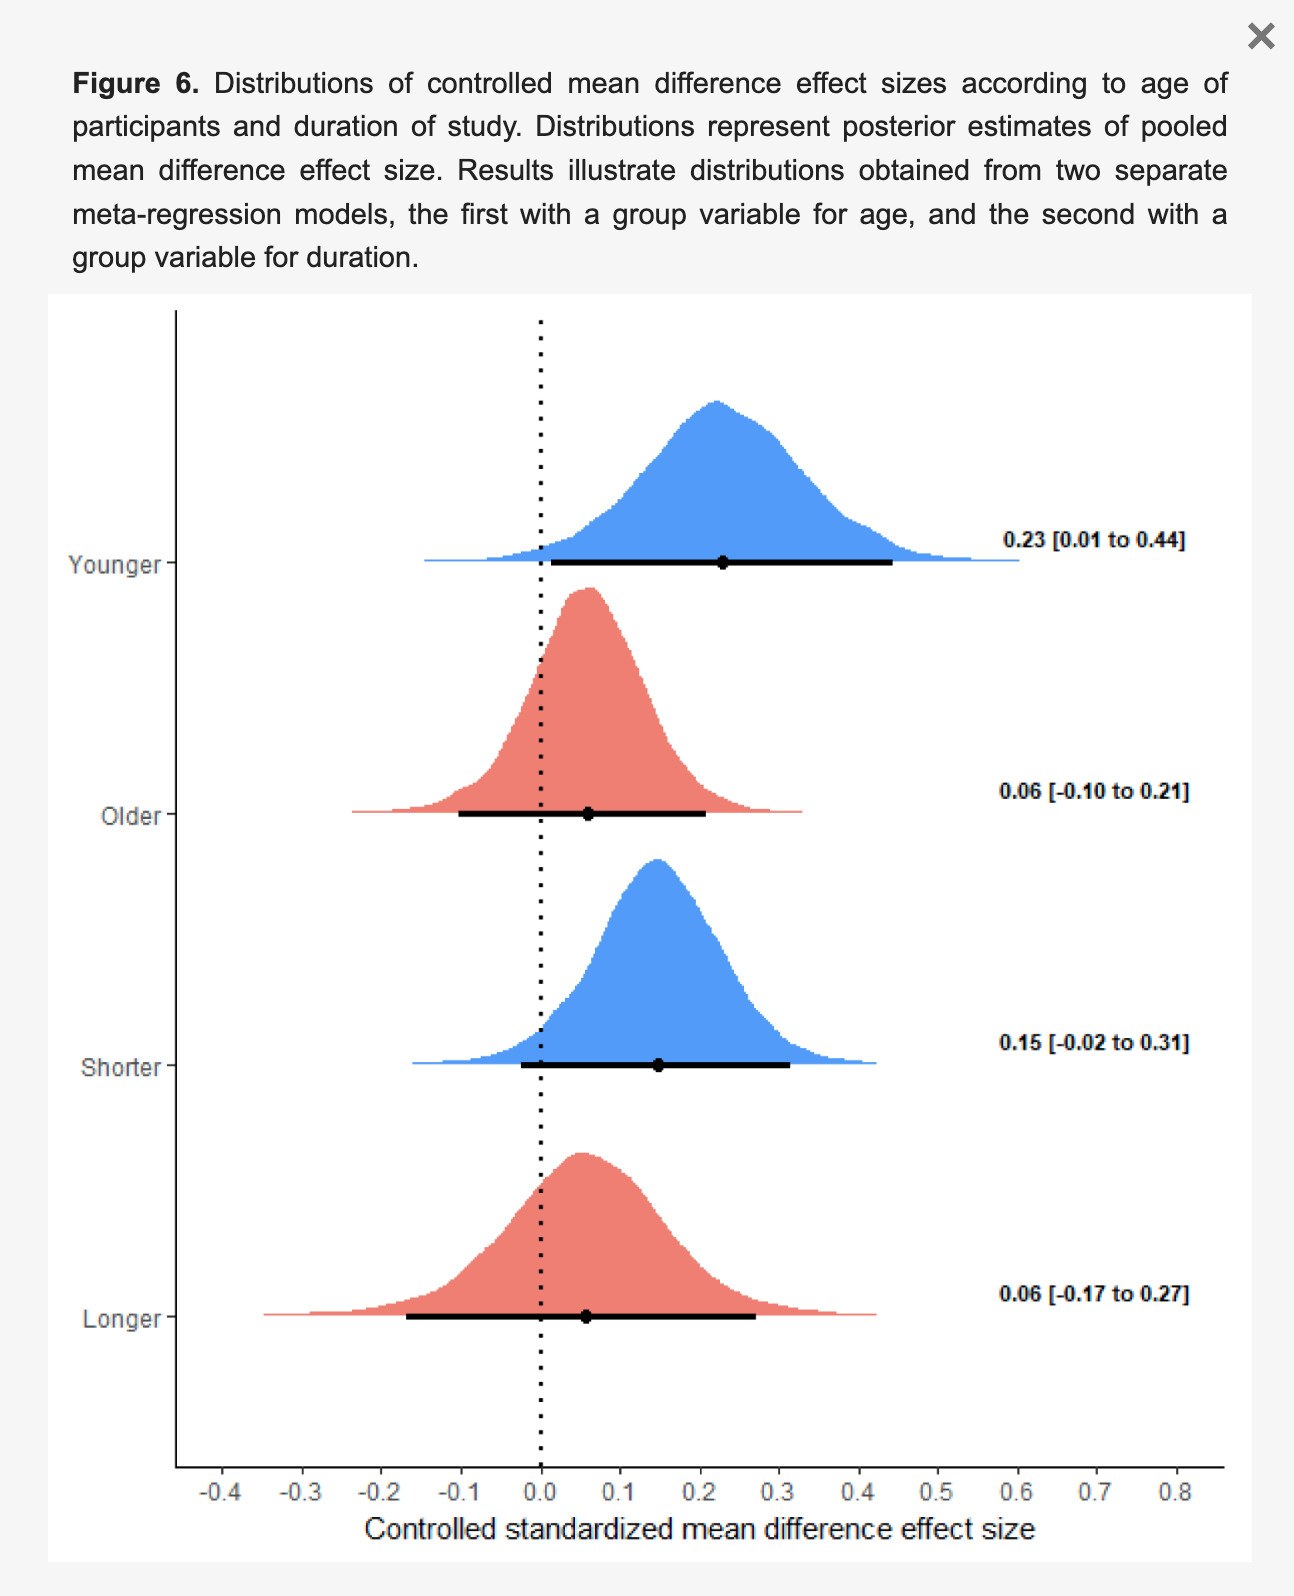
Finally, the effect appeared to be larger in younger adults (mean age: 23.5 years) than older adults (mean age: 61.6 years), and in shorter-term studies (6-16 weeks) than longer-term studies (52 weeks). Though, it’s worth noting that those aren’t necessarily independent findings – all of the long-term studies were also studies on older adults, and the short-term studies on older adults also reported very small effect sizes.
I’m a bit late to the party for discussing this meta-analysis. It was published in April, and creatine is always a popular topic, so most folks who disseminate sciency fitness content have already shared their two cents. The most common interpretation is that creatine isn’t as effective as we’ve previously been led to believe: Instead of having a notable effect on muscle growth, it only has a “trivial-to-small” impact, according to this meta-analysis.
I completely understand where that interpretation is coming from, but I also think it’s a bit off base. So, even though I’m well behind this wave of discourse, I still figured it was worth weighing in.
Let’s discuss effect sizes
To explain where I’m coming from, we first need to take a couple steps back and discuss effect sizes. There are quite a few different types of effect sizes, but the effect sizes used in the present meta-analysis (and most meta-analyses in the field) were standardized mean differences in the Cohen’s D family.
Standardized mean differences essentially ask the question, “By how many standard deviations did this measure change?” or “By how many standard deviations did the changes in these two groups differ?”
So, if you have a within-group standardized mean difference of 0.4, that means that the outcome measure changed by 0.4 standard deviations. In other words, if you had the standard response to the intervention, and you were perfectly average at the start of the study, you’d be 0.4 standard deviations better than the pre-training average at the end of the study.
Similarly, if you have a between-group standardized mean difference of 0.2, that means that one group experienced a change that was 0.2 standard deviations larger than the other group. So, if one group improved by 0.4 standard deviations, the other group may have improved by 0.6 standard deviations.
To put some real numbers on it, let’s assume you have two groups, each of whom have a pre-training bench press 1RM of 100 ± 10kg (mean ± standard deviation). Group 1 does Program A, and Group 2 does Program B. At the end of the study, Group 1 put an average of 10kg on their bench press 1RM, and Group 2 put an average of 15kg on their bench press 1RM. So, the within-group effect sizes would be 10kg/10kg 1mean change/pre-training standard deviation = 1.0 for Group 1, and 15kg/10kg = 1.5 for Group 2. Similarly, Group 2 experienced a 5kg larger strength increase, so the between-group effect size would be 5kg/10kg 2 difference between mean changes/pre-training standard deviation = 0.5 in favor of Group 2.
I personally prefer to interpret standardized mean differences literally (for whatever reason, I find thinking in standard deviation units to be pretty intuitive), but it’s common practice to put labels on ranges of effect sizes to denote the magnitude of the effect. This is the most common set of labels you’ll see:
| Effect Size Classifications, From Cohen (1988) | |
| Effect Size | Classification |
| 0-0.19 | Trivial |
| 0.2-0.49 | Small |
| 0.5-0.79 | Medium |
| 0.8+ | Large |
However, most people don’t stop to ask where those effect size labels came from.
They come from a 1988 textbook about statistical power for psychology. The author, Jacob Cohen, was the person who popularized magnitude-based effect sizes. The impact of his work shouldn’t be overlooked, but the context of his work shouldn’t be overlooked either: He was writing to other psychologists and behavioral scientists about how to interpret psychology and behavioral science results.
Here’s the rub: How you interpret effect sizes is extremely context-dependent. In situations where large changes frequently occur, a standardized mean difference of 1.0 may be a pretty small effect. Conversely, in situations where small changes can have a huge impact, a standardized mean difference of 0.3 may actually be indicative of a very large effect.
Just to illustrate, let’s assume that, in untrained powerlifters, the average powerlifting total (squat + bench press + deadlift) is 300 ± 30kg. Similarly, let’s assume that for world-class powerlifters in a particular weight class, the average total is 800 ± 30kg. If an untrained powerlifter and a world-class powerlifter both added 30kg to their totals over the course of a year, would you interpret those increases the same way?
I doubt it (or, at minimum, I hope not). You’d expect the untrained powerlifter to add way more than 30kg to their total over the course of a year: A standardized mean difference of 1.0 would be indicative of a pretty small effect, because most other untrained lifters would experience considerably larger changes. Conversely, the world-class powerlifter would be over the moon if they added 30kg to their total over the course of a year: A standardized mean difference of 1.0 would be indicative of a very large effect, because most other world-class lifters would experience considerably smaller changes. So, a standardized mean difference of 3.0 in untrained lifters might have the same meaning as a standardized mean difference of 0.3 in elite lifters – depending on the population, context, and outcome, you can (and should) interpret the same standardized mean difference in very different ways.
This isn’t a novel insight, by any means. Way back in 2004, Dr. Matthew Rhea even proposed different sets of effect sizes for strength training research based on the subjects’ training status.

We should probably interpret hypertrophy-related effect sizes differently
In fact, the authors of the present creatine meta-analysis (I promise I haven’t forgotten that this is an article about the creatine meta-analysis – this is a lengthy but necessary detour) used a set of effect size interpretations designed specifically for strength and conditioning research. They presumably recognized that a set of effect size interpretation thresholds coming from the behavioral sciences weren’t ideal for resistance training outcomes.
| Effect Size Classifications, From Swinton and Murphy (2022) | |
| Effect Size | Classification |
| 0-0.13 | Trivial |
| 0.14-0.28 | Small |
| 0.29-0.50 | Medium |
| 0.51+ | Large |
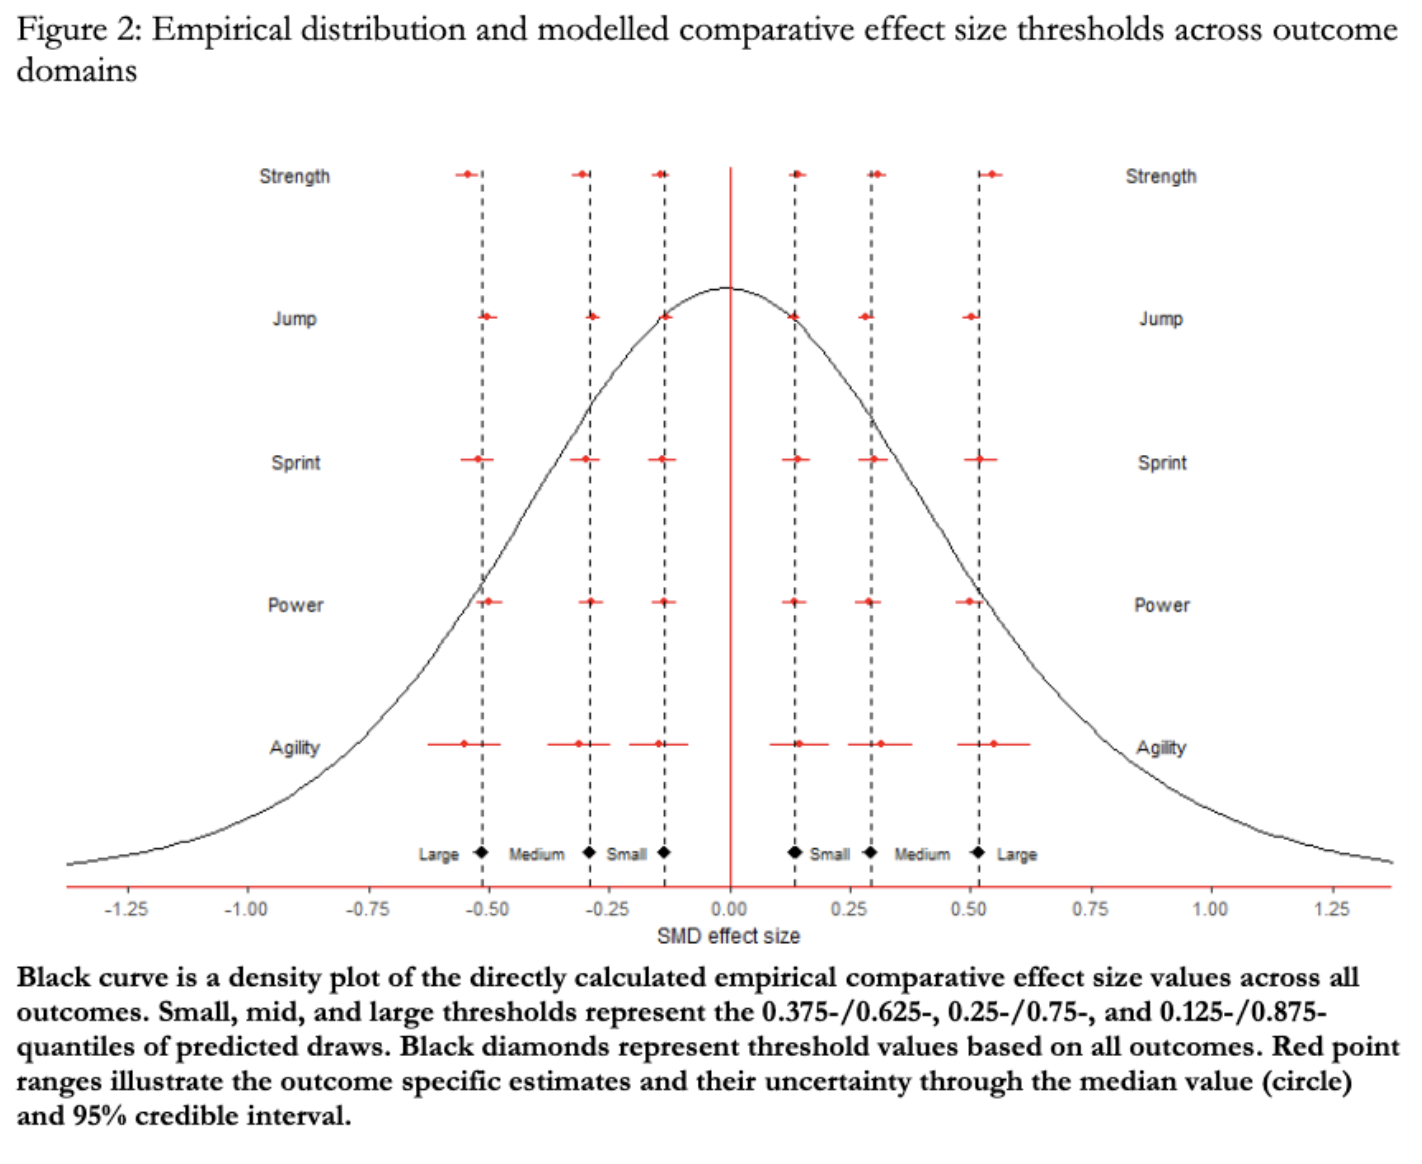
However, I suspect that these effect size thresholds are still a bit too large for hypertrophy research. They were derived from studies on strength outcomes, jump height, sprint times, power output, and agility measures – not studies on hypertrophy outcomes. And, in general, measures of performance are simply capable of increasing to a far greater extent than measures of muscle size.
A 2022 study by Steele and colleagues documented the typical effect sizes observed in both strength research and hypertrophy research. You can see those results below.

The average change in strength observed in the literature is associated with a standardized mean difference of 0.87. Conversely, the average increase in muscle size observed in the literature is associated with a standardized mean difference of just 0.34. That suggests to me that standardized mean differences should be interpreted a bit differently for strength and hypertrophy outcomes.
A between-group difference associated with an effect size of 0.28 may truly be a “small” difference in the context of strength research. If one group has an effect size of 0.73 (a little below average), and another group has an effect size of 1.01 (a little above average), you might reasonably say that the difference between groups is pretty small.
However, in the hypertrophy research, a between-group difference of 0.28 might mean one group had a within-group effect of 0.20, while the other group had a within-group effect of 0.48. The between-group standardized mean difference is the same (0.28 in both examples), but since typical changes are so much smaller in the hypertrophy research, the relative impact of a between-group effect size of 0.28 is much larger. I don’t think most people would interpret a 2.4-fold difference in hypertrophy to be a “small” difference.
Bringing it back to the creatine meta-analysis
With that in mind, I think we can proportionally scale Swinton and Murphy’s effect size classifications to make them more relevant for hypertrophy research. The average within-group standardized mean difference for hypertrophy outcomes (0.34) is about 39% as large as the average within-group standardized mean difference for strength outcomes (0.87). So, the effect size interpretation thresholds should also scale proportionally, unless we assume that interventions designed to promote greater hypertrophy are (relatively) far more effective than interventions designed to promote greater strength gains (or vice versa). If we proportionally scale those interpretation thresholds, here’s what we get:
| Rough Effect Size Classifications for Hypertrophy Outcomes | |
| Effect Size | Classification |
| 0-0.054 | Trivial |
| 0.055-0.1 | Small |
| 0.11-0.19 | Medium |
| 0.2+ | Large |
With these interpretation thresholds, the present meta-analysis would suggest that creatine has an overall small-to-medium effect on muscle growth, with trivial-to-small effects observed in older adults, and medium-to-large effects observed in younger adults.
Now, you might reasonably accuse me of (quite literally) moving the goalposts, to which I’d first respond, “Touché. Fair critique.” However, I’d also note that all of these goalposts are pretty arbitrary in the first place. Most effect size interpretations are still based on one guy’s suggestions about how to interpret behavioral science research. The interpretation thresholds used by the authors of the creatine meta-analysis came from research on strength, power, and agility outcomes. Is it really so crazy to suggest that hypertrophy effect sizes should be graded on their own scale?
Basically, I’m not moving the goalposts because I’m married to any particular interpretation of this meta-analysis. I’m moving the goalposts because I think the original goalposts may have been bad goalposts, for the reasons discussed previously.
A more literal interpretation
As mentioned previously, I don’t really like effect size classifications in the first place. I prefer the direct, literal interpretation of standardized mean differences. Just tell me how many standard deviations something changed by, and I can decide for myself whether that’s a relatively small or a relatively large change, or a relatively small or a relatively large difference between groups.
In this case, the math is pretty simple. The average standardized mean difference for within-group hypertrophy outcomes is 0.34 in exercise science research. So, measures of muscle size generally increase by about 0.34 standard deviations following a training intervention. This meta-analysis suggests that creatine has an additive effect on hypertrophy, associated with a standardized mean difference of 0.11. So, when people take creatine, their muscle size increases by an additional 0.11 standard deviations. That means, in real terms, this meta-analysis suggests that creatine will help you build muscle about 1/3rd faster than you otherwise would have.
I personally don’t view that as a trivial effect. If I could choose between building 3 pounds of muscle or 4 pounds of muscle, I’m probably going to choose 4 pounds of muscle. That’s not a night-and-day difference, but it’s certainly a notable difference.
I’ll also note that I checked the within-group effect sizes in the present creatine meta-analysis to make sure they tracked with the rest of the literature. The average within-group effect size in the placebo groups: 0.33. In other words, these studies dovetail nicely with the rest of the hypertrophy literature, bolstering the takeaway that creatine increases your rate of muscle growth by approximately 1/3rd.
Final considerations
To be clear, there’s still plenty of variability in that estimate. Responsiveness to creatine differs from person to person. Some people are creatine non-responders. Therefore, logically, plenty of people also have above-average responses to creatine (that’s the only way a positive average effect makes any sense). So, if creatine increases hypertrophy by approximately 1/3rd on average, that doesn’t necessarily mean that it will increase your rate of muscle growth by approximately 1/3rd.
This meta-analysis also invites us to consider whether the effects of creatine wane over time, since the effect sizes in shorter-term studies were larger than the effect sizes in longer-term studies.
I personally think there are two extremely justifiable interpretations of this finding.
- The (apparent) relative effects of creatine actually do decrease over time. While direct measures of hypertrophy will be less affected by fluid retention than measures of lean mass, creatine does likely increase intramuscular water content to some extent. So, shorter-term studies might be overestimating the effects of creatine on “actual” hypertrophy, because they’re still picking up on increased muscular fluid content. Over longer time scales, the differences between groups are more reflective of the “true” effect of creatine.
- The apparent effect of time is actually just an effect of age. As noted previously, all of the long-term studies were studies on older adults. Furthermore, the shorter-term and longer-term studies on older adults had broadly similar findings. So, it might be the case that older adults simply experience less hypertrophy, which makes the nominal additive effect of creatine appear smaller, regardless of study length.
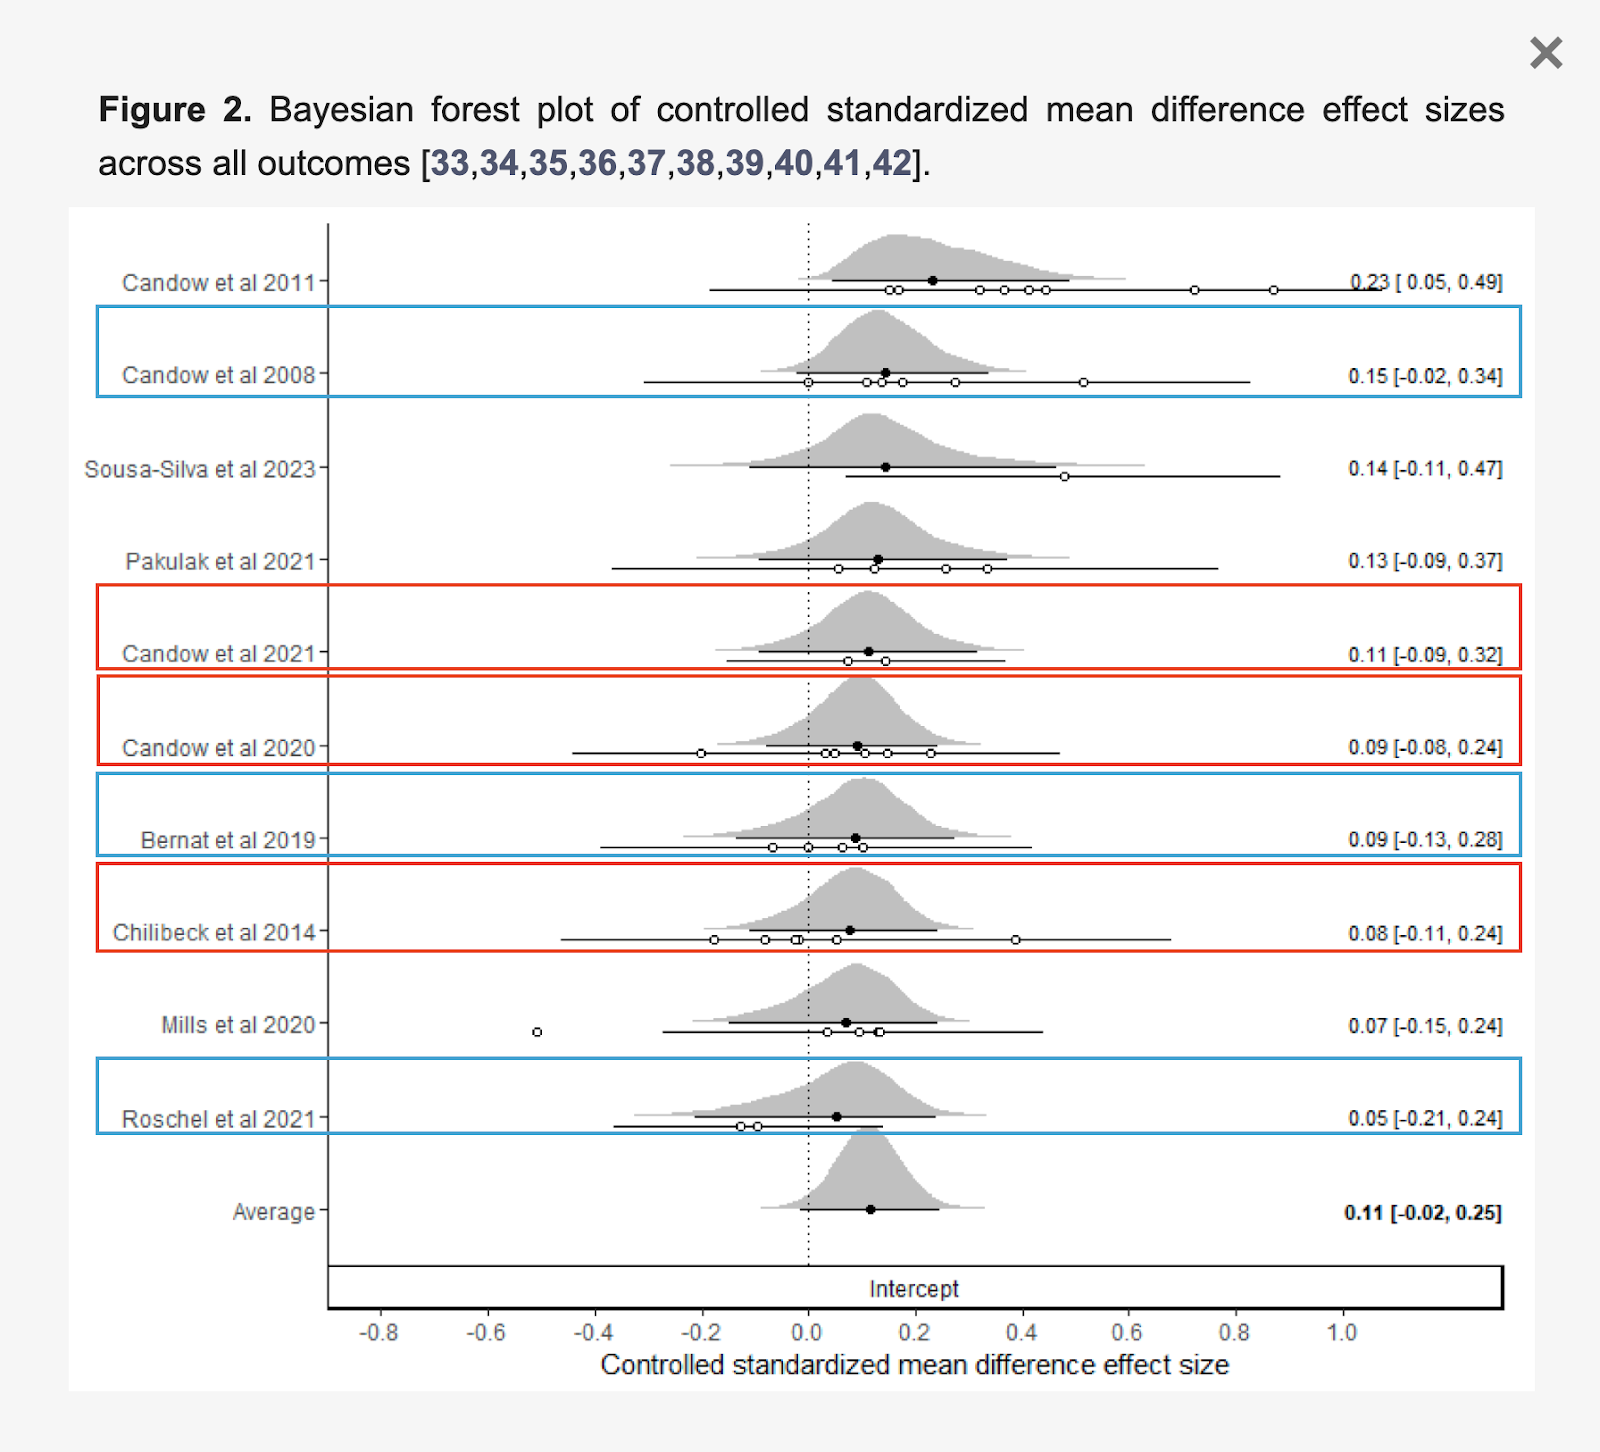
Boxes added by SBS team for illustrative purposes. Original graphic from “The Effects of Creatine Supplementation Combined with Resistance Training on Regional Measures of Muscle Hypertrophy: A Systematic Review with Meta-Analysis.” Burke et al (2023)
I’m personally comfortable withholding judgment on the matter until we have some longer-term studies in younger adults to serve as a point of comparison.
Overall, I think a lot of people found this meta-analysis to be pretty surprising. They believed creatine was an effective supplement to help with muscle growth, and were dismayed to find out that the effect of creatine was merely a “trivial” effect. However, I think this meta-analysis just confirms what people have been saying about creatine for ages: Taking creatine isn’t going to double or triple your rate of muscle growth, but it will likely have a positive, notable impact on your gains.
Ultimately, I think the disconnect came from the way most readers interpret effect sizes: taking the language used to describe the effect sizes (i.e. “trivial-to-small”) at face value, without pausing to reflect on what the effect size is literally communicating, and without stopping to consider effect sizes contextually. A between-group effect size of 0.11 means something different in an area of the research where within-group effect sizes of ~0.9 are typical (like strength research) than in an area of research where within-group effect sizes of ~0.3 are typical (like hypertrophy research).
So, I did want to write this article to push back against some of the creatine doomerism I’ve seen in the past few months, but I mostly wanted to write this article to discuss effect size interpretation more broadly. Hopefully this article gave you something to chew on. If it helps you think a bit more critically about interpreting effect sizes in their proper context – instead of just accepting the classification label a study puts on a particular effect size – it will have served its purpose.
For more on creatine, including mechanisms of action, interactions with caffeine, potential effects on hair loss, and more, you should check out our guide on creatine supplementation.