
What you’re getting yourself into
5300 words, 17-35 minute read time
Key Points
1) The most common method people use to compare relative strength is strength/bodyweight ratios. However, this standard is horribly flawed.
2) The formulas used to compare relative strength in powerlifting (most notably the Wilks formula) have their own issues. The two biggest problems with the Wilks formula are that it’s not regularly updated, and it’s notably biased against middleweight lifters.
3) Allometric scaling is an alternative to strength/bodyweight ratios and formulas like Wilks. It has strong theoretical support, and it works very well in practice.
4) I also developed another formula to compare relative strength that fixes some of the main problems with the Wilks formula.
This article will give you a few ways to attempt to objectively answer an inherently subjective question, propose a new way by which we can accurately judge strength, and introduce you to an older method that works very well, but that few people know about.
Absolute strength vs. relative strength
The first thing to make clear: the difference between absolute and relative strength. Absolute strength simply refers to how much you can lift regardless of bodyweight. If someone benches 400lbs at 150lbs, and someone else benches 405lbs at 300lbs, the latter person has more absolute strength.
However, the person who benches 400lbs at 150 has more relative strength; they have more strength relative to their bodyweight.
These are pretty basic concepts, but they’re worth mentioning at the start just to make sure we’re all on the same page.
Absolute strength is incredibly straightforward – it’s simply a matter of lifting the most weight, period. Relative strength is a little slipperier, however. How to best gauge relative strength isn’t as straightforward a problem as most people think.
Bodyweight multipliers – an awful standard
The most common way people assess relative strength is via a bodyweight multiplier. For example, being able to squat 2x your bodyweight.
Some common standards for “strong” I’ve seen thrown around include a 2x bodyweight squat, a 1.5x bodyweight bench press, and a 2.5x bodyweight deadlift, with “elite” multipliers being something more like a 2.5x bodyweight squat, 2x bodyweight bench press, and a 3x bodyweight deadlift.
However, there are two major problems with calculations like those:
- They favor lighter lifters. For example, a 3x bodyweight deadlift at 150lbs is 450lbs. That’s a damn solid deadlift, but nothing too out of the ordinary. However, at 300lbs, that same standard would require a 900lb deadlift – a lift that fewer than 100 people have ever achieved.
- They deny biological reality.
That second statement is quite a bold one, but it’s well-supported both theoretically and experimentally. We’ll get to that in a second. First, check out the all-time world records in powerlifting, as a function of bodyweight:
| Weight Class | Squat (with wraps) | Squat/ bodyweight | Bench | Bench/ bodyweight | Deadlift | DL/ bodyweight | Total (with wraps) | Total/ bodyweight |
| 123 | 639 | 5.2 | 455 | 3.7 | 634 | 5.15 | 1339 | 10.89 |
| 132 | 565 | 4.28 | 462 | 3.5 | 628 | 4.76 | 1471 | 11.14 |
| 148 | 611 | 4.13 | 498 | 3.36 | 697 | 4.71 | 1581 | 10.68 |
| 165 | 710 | 4.3 | 529 | 3.21 | 717 | 4.35 | 1714 | 10.39 |
| 181 | 744 | 4.11 | 556 | 3.07 | 791 | 4.37 | 1840 | 10.17 |
| 198 | 810 | 4.09 | 565 | 2.85 | 870 | 4.39 | 2028 | 10.24 |
| 220 | 915 | 4.16 | 586 | 2.66 | 901 | 4.1 | 2110 | 9.59 |
| 242 | 881 | 3.64 | 661 | 2.73 | 893 | 3.69 | 2210 | 9.13 |
| 275 | 992 | 3.61 | 675 | 2.45 | 906 | 3.29 | 2380 | 8.65 |
| 308 | 1030 | 3.34 | 701 | 2.28 | 939 | 3.05 | 2425 | 7.87 |
Note: All records in this article were current as of August 2015
As you can see, in almost every case, the strength as a multiple of bodyweight drops off from weight class to weight class. You’re not going to see a super heavyweight (or even a middleweight) pull a 5x bodyweight deadlift like Lamar Gant, and you’re not going to see any middleweight or heavyweight benchers lift 3.5x their bodyweight any time soon. Since these are all world records, they’re presumably all extremely impressive, even though the bodyweight multipliers drop off almost linearly between weight classes. Clearly, bodyweight multipliers aren’t a very good standard for comparing relative strength across a wide range of body weights. If they were, you’d expect pretty similar strength/weight ratios across the board when looking at the world records.
So let’s rewind a bit. What was all of that “biological reality” business? Glad you asked. This leads us to…
Allometric Scaling
Allometric scaling refers to the changes that take place within a species or between species as sizes change.
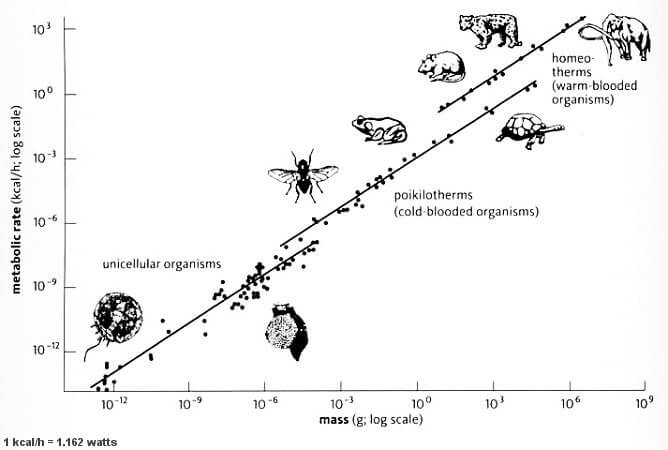
There are all sorts of neat applications for allometric scaling. The coolest would probably be the relationship between metabolic rate and body size. When you plot metabolic rate and body size of different animals, as small as a mouse or as large as a whale, against each other on logarithmic scales, you get an almost perfectly linear relationship, with a slope of 3/4. This is known as Kleiber’s Law.
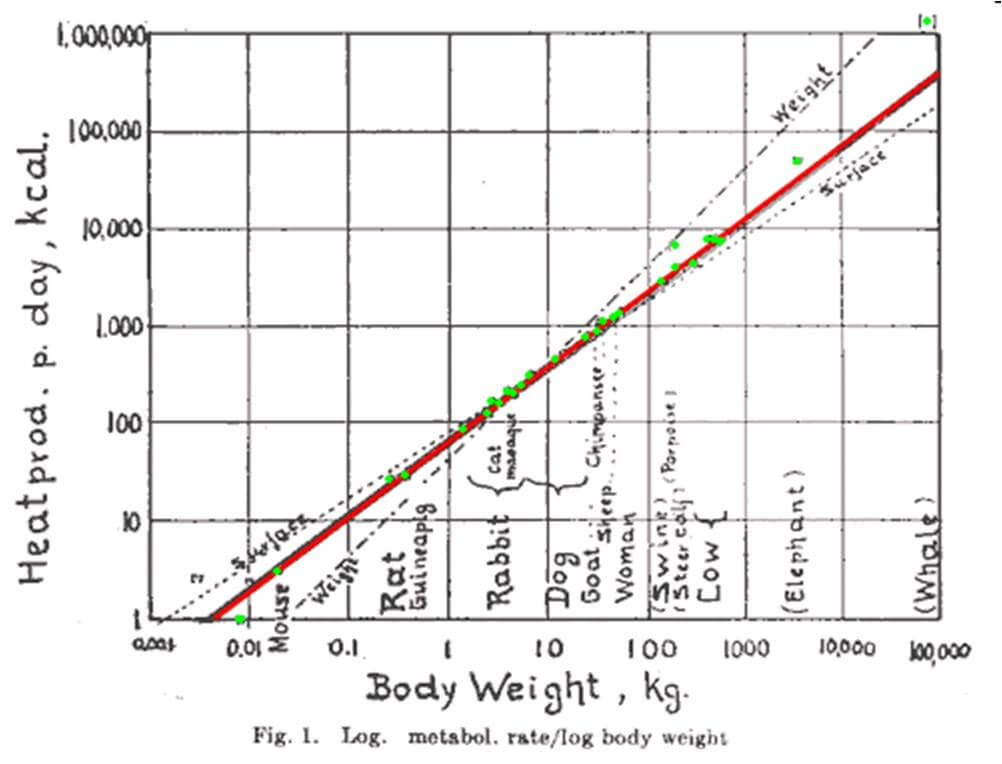
Since Kleiber’s original discovery in 1947, this same basic relationship relationship between mass and metabolic rate has been found to apply to things even smaller than a mouse as well, including bacteria, mitochondria, and even individual respiratory complexes. It’s been refined a bit to separate single-celled organisms, cold-blooded animals, and warm-blooded animals (all of them display this same basic relationship, but the slopes of the resultant trend lines deviate slightly from 3/4), but even 70 years later, this fundamental allometric relationship has proven to be very well-supported and durable.
Here’s an easy example to put this relationship in perspective:
A mouse that weighs 30g has a basal metabolic rate of about 5kcal. That may not sound like much, but it works out to about 1kcal per 6g of weight. A human weighing 80kg (80,000g), on the other hand, would have a basal metabolic rate of about 1800kcal per day, meaning they’d need to eat 1kcal per 44-45g of weight. In other words, the metabolism of a mouse is 7-8x faster than ours, per unit of weight.
Strength scales with size in a similar manner. For example, you can compare an ant to Hafþór Björnsson, one of the top three superheavyweight strongmen in the world.
Ants routinely carry more than 20x their bodyweight for long distances, and modeling research shows that an ant could theoretically hold about 5000x its own weight (after which point its neck – the weakest part of its body – would snap).
Björnsson, on the other hand, wowed people in early 2015 by carrying a 640kg (~1400lb) log, roughly 3.5x his bodyweight, for five steps. I’m not exactly sure how much weight it would take to crush a human, but I assume it would be a shade less than 400,000kg (882,000lbs) – about 5000x the weight of an average-sized person. I’m not sure why crushing humans has never been studied. I guess it makes ethics boards uneasy.
Allometric scaling is particularly applicable for relative strength because of two simple relationships that change at predictable rates based on the size differences between people.
The first is muscle contractile force, which is directly related (almost a perfect 1:1 relationship) with muscle cross-sectional area. Cross-sectional area is a second order (mathematics definition – something being raised to the second power) characteristic; you measure it in cm2.
The second is body mass, which is related to the volume of someone’s body. If two people have similar densities (and most people do), then the person with more volume will weigh more, in a manner directly proportional to the volume difference. Volume is a third order (something being raised to the third power) characteristic – measured in cm3 or m3.
One quick soapbox regarding density. I see pictures like this one crop up all over the place, usually with the message of “muscle is more dense than fat, so you can weigh the same and be way smaller if you lose fat and gain muscle.”
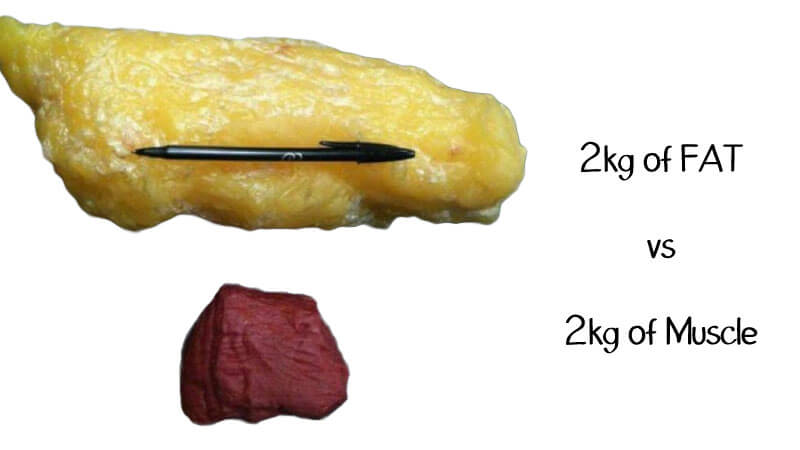
That’s absolutely bogus. The density of muscle is about 1.06kg/L, and the density of fat is about .9kg/L. In other words, muscle IS more dense than fat, but only about 15% more dense. This is a more accurate representation:

It’s a large enough difference that you can assess someone’s body fat percentage with somewhat reasonable accuracy using underwater weighing or a bod pod (which work by calculating body density), but it’s not as big of a difference as some people think, unless there are big differences in body fat. That’s a major issue I’ll address in a second.
Yes, most people still look sexier at the same weight with more muscle and less fat, but it’s not because there’s the huge difference in tissue densities like some people think.
Going back to allometric scaling, you should expect body mass to increase faster than strength. If all of your proportions increased two-fold, you should expect to be 4 times as strong (22), while weighing 8x as much (23) assuming your body composition was the same. If you were to plot size and strength on logarithmic scales (like the metabolism graphs above), the resultant line would have a slope around 2/3, rather than 3/4.
Using this relationship, you can use the equation SxM-2/3 to give you an allometric scaling score to compare two feats of strength. For example, let’s say you wanted to compare a 300lb squat at 150lbs, and a 405lb squat at 220lbs.
The former would give you an allometric scaling score of 10.6266, and the latter would give you an allometric scaling score of 11.1132. So, even though the 300lb squat at 150lbs is 2x bodyweight and the 405lb squat at 220 is only 1.84x bodyweight, the 405lbs squat is a more impressive lift, given the biological reality of allometric scaling.
If you want to compare two lifts (or compare your strength to a friend’s) using allometric scaling, you can use the form below. It’ll do the calculations for you!
If this sounds like a bunch of theoretical mumbo jumbo, keep in mind that it’s generally agreed upon as the ideal way to scale strength performance in the research community, and it’s been validated in a host of populations including high-level football players.
If that doesn’t do it for you, compare this chart to the previous one looking at the all-time records in powerlifting based on their bodyweight multipliers:
| Weight Class | Squat (with wraps) | Squat Allometric | Bench | Bench Allometric | Deadlift | Deadlift Allometric | Total (with wraps) | Total Allometric |
| 123 | 639 | 25.84 | 455 | 18.4 | 634 | 25.63 | 1339 | 54.14 |
| 132 | 565 | 21.79 | 462 | 17.82 | 628 | 24.22 | 1471 | 56.74 |
| 148 | 611 | 21.84 | 498 | 17.8 | 697 | 24.91 | 1581 | 56.51 |
| 165 | 710 | 23.6 | 529 | 17.58 | 717 | 23.83 | 1714 | 56.98 |
| 181 | 744 | 23.25 | 556 | 17.38 | 791 | 24.72 | 1840 | 57.5 |
| 198 | 810 | 23.84 | 565 | 16.63 | 870 | 25.61 | 2028 | 59.7 |
| 220 | 915 | 25.11 | 586 | 16.08 | 901 | 24.72 | 2110 | 57.9 |
| 242 | 881 | 22.69 | 661 | 17.02 | 893 | 23 | 2210 | 56.91 |
| 275 | 992 | 23.46 | 675 | 15.96 | 906 | 21.42 | 2380 | 56.28 |
| 308 | 1030 | 22.58 | 701 | 15.37 | 939 | 20.59 | 2425 | 53.17 |
Hey, that looks a lot better! As you can see, comparing the records via allometric scaling puts all the weight classes on a much more level playing field. There are two exceptionally high numbers in the squat (Stanaszek’s ridiculous 638 at 123 – here’s 617 at 114), and Sam Byrd’s 915 at 220. The rest are hanging around in a little cluster from 21.7 to 23.9.
For bench, there appears to be a bias for lightweights, but you have to keep in mind that the world records in the lightest four weight classes are held by paralympic athletes. While they can’t get leg drive, they can have a lot more upper body muscle mass than non-Paralympians of the same weight, giving them a definite advantage (similar to Stanaszek’s advantage in the squat due to dwarfism, or Gant’s advantage in the deadlift due to scoliosis). For example, here’s Lei Liu crushing a 498 bench at 148, which beat the previous world record by 58lbs. Other than the paralympians, the records cluster around 16-17.4. The bench record of 701 at 308 is the only one notably below the rest.
For the deadlift, I expected Lamar Gant’s 634 at 123 to be a definite outlier like Stanaszek’s squat, but Belyaev’s 870 at 198 is nipping at its heels. However, Konstantinov’s massive deadlifts at 275 and 308 lag behind the rest, and it seems like allometric scaling may put larger lifters at a slight disadvantage.
For the total, there are no clear signs of a bias for or against any particular group. The only two records lagging behind the rest are the 123 and 308 records, with most of them bunched around 56-58, and only Ernie Lilliebridge Jr’s 2028 at 198 standing out above the pack.
The same basic patterns hold when looking at the IPF raw world records as well (in kg this time):
| Weight class | Squat | Squat Allometric | Bench | Bench Allometric | Deadlift | Deadlift Allometric | Total | Total Allometric |
| 59 | 226 | 14.91 | 170 | 11.22 | 270.5 | 17.85 | 661 | 43.61 |
| 66 | 240.5 | 14.73 | 182.5 | 11.17 | 278 | 17.02 | 653.5 | 40.01 |
| 74 | 260 | 14.75 | 210.5 | 11.94 | 310.5 | 17.62 | 712.5 | 40.42 |
| 83 | 280.5 | 14.74 | 205 | 10.77 | 316 | 16.61 | 783.5 | 41.18 |
| 93 | 303 | 14.76 | 232.5 | 11.33 | 372.5 | 18.15 | 847.5 | 41.29 |
| 105 | 330 | 14.83 | 221.5 | 9.95 | 343 | 15.41 | 867.5 | 38.98 |
| 120 | 375 | 15.41 | 235 | 9.66 | 371.5 | 15.27 | 945 | 38.84 |
Again, there’s no clear bias. The squats are extremely level across the board, with only Mohamed Bouafia’s 375 at 120 standing out from the pack.
The bench press seems to favor lighter lifters, but I suspect that’s just because there hasn’t been a great bencher at 105 or 120 to set an imposing mark since the IPF restructured its weight classes. If Dennis Cieri can bench 232.5 at 93, I’m sure a 105 or 120 will bench more than 221.5 or 235, respectively. In fact, Cieri has also benched 237.5 at 93, though it wasn’t at a meet that was eligible for setting IPF world records.
The deadlift seems to favor lighter lifters a bit as well, just as it did for the all-time records. However, Krzysztof Wierzbicki’s 372.5 at 93 makes me think that, much like for the bench, the heavyweights will catch up eventually.
Finally, the totals don’t show any clear bias. They’re all bunched between 38.9 and 41.3, with the exception of Sergey Fedosienko’s absurd 661 at 59.
Allometric scaling has strong theoretical support, and seems to work well when comparing powerlifting performances across the board. Although, it may be biased against heavier lifters somewhat in the deadlift.
However, it does have one major drawback.
What to do with superheavyweights?
Allometric scaling works so well because of that relationship between force production (muscle cross-sectional area) and weight (body volume). As long as those two factors maintain a close relationship and increase at predictable rates allometric scaling should accurately compare strength performances.
However, there’s one major factor that skews that relationship: body fat. Most top lightweight and middleweight lifters have similar levels of body fat – most hovering around 10-15%. Even some heavyweights (125 and 140kg lifters on drugs, and 105 and 120kg lifters without them) can manage to stay relatively lean. However, you don’t come across many shredded superheavyweights, and that’s reflected in their allometric scaling scores.
For example, Ray Williams’ amazing 425.5kg squat at 171.65kgs (938 at 378) leaves him with an allometric scaling score of 13.78. The average for the other seven weight classes was 14.88; his squat would score about 6.5% lower than any of the other world records. Benedict Magnusson’s 1015lb deadlift at 381lbs (460kgs at 173kg) fares about the same; it leaves him with an allometric scaling score of 19.31, well below the average of 23.87 in the other 10 weight classes.
None of the untested all-time world records are remotely close to the field. Only Ilyes Boughalem’s 270.5kg bench at 143.72kg (596 at 317) is competitive with the other IPF world records; its score of 9.86 beats out the 120kg record. You’ll also notice that he’s the smallest superheavyweight world-record holder in either the IPF or in untested competition.
The egalitarian urge is to do something to put the superheavyweights on a level playing field with everyone else. In fact, that’s what other attempts to compare relative strength have done. However, I think that urge is misguided.
How do we make it fair across the board?
That’s the question people have attempted to answer with the formulas used in powerlifting and weightlifting competitions.
Powerlifting has used several formulas through the years. The first was the Schwarz/Malone formula, developed in the 70s by Lyle Schwarz and Pat Malone, based off data from the top lifters in the fledgling sport of powerlifting.
In the mid ’90s, people felt like it was time for an update, so the Wilks formula was developed by Robert Wilks based off updated data from the top competitors of the day.
In the mid 2000s, people felt like the older Schwarz/Malone formulas gave the lightweights an advantage, while the Wilks formula gave heavyweights an advantage, and thus the Glossbrenner formula came about, with which Herb Glossbrenner essentially split the difference between the Schwarz/Malone and Wilks formulas.
There have been a few other formulas through the years, but they’ve largely been replaced by the Wilks formula and the Glossbrenner formula. Wilks is still the most popular formula, used in the IPF and its affiliates, so it’s what I’ll be using as a benchmark for the rest of this article.
The problems with Wilks
The Wilks formula is based on a 5th order polynomial reflecting the best fit relationship between body mass (or weight class category, by kg) and “informed estimations” of what world class lifters should be capable of lifting (personal communication, R. Wilks, 1997) derived from various IPF national and international men’s and women’s 1987 to 1994 competition data.
1. Bias against middleweights
A major problem with Wilks scores arises from how the formula was derived. It was based on competitors from a bunch of different meets, and from multiple high-level lifters in each weight class.
At first, this may sound like a strength of the Wilks formula, but it has one major shortcoming: Most people are average-sized. There are about twice as many middleweight powerlifters as there are lightweights or heavyweights. Based on sheer probability, the top 10 middleweights (not necessarily “middleweights” meaning the middle three weight classes, but rather the weight range that lean, muscular, mostly shorter-than-average people generally fall into – roughly 65-90kg) represent more total talent than the top 10 lightweights or heavyweights.
If we assume there are 5 people with “Top 5” talent in the lightweight and heavyweight classes, 5 more people with “Top 10” talent, and 10 more with “Top 20” talent in those classes, then with twice the number of lifters, there would be 10 middleweight lifters with the same talent as the “Top 5”-caliber lightweights or heavyweights, 10 more with “Top 10” talent, and 20 more with “Top 20” talent – twice as many lifters at each performance tier.
So, when a formula is developed based on the results from multiple top lifters in each weight class, the middleweights get screwed because there are simply more talented middleweights than lightweights or heavyweights. If the formula is based on, say, the best 10 lifters from each weight class, the formula would be based on 10 middleweights with “Top 5” talent, and 10 lifters with a 50/50 split between “Top 5” and “Top 10” talent for the heavyweights and lightweights.
This is born out by comparing Wilks Score to Allometric Scaling Scores (which DO give an accurate comparison of relative strength, both in theory and practice).
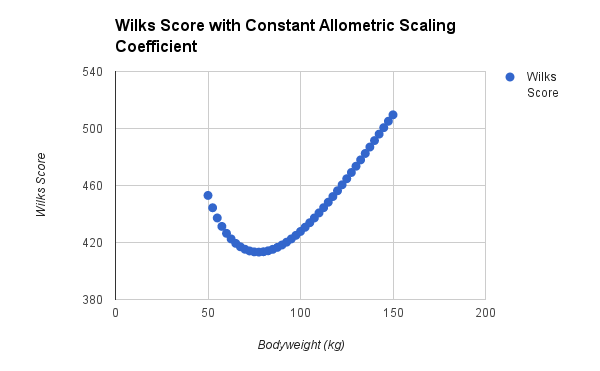
Here, I kept Allometric Scaling Score constant, and examined how changes in weight would impact Wilks Score. As you can see, there’s a definite dip in the middle of the graph.
So, what’s the low point in the graph? To the nearest 100th of a kilo, it’s 77.21kg (170.22lbs). Men who weigh about 65-92.5kg (143-204lbs) get the short end of the stick with Wilks scores. For women, the lowest point is at 71.87kg, or 158.45lbs.
It seems that Wilks’ reputation for favoring heavier lifters is warranted. If a lifter can maintain a fairly good body composition and lift at a very high level at 110kg (242lbs), they have a 6.7% advantage in Wilks score over a 70-75kg lifter with the same allometric scaling score. By 125kg (275lbs), the gap widens to 12.5%. Lightweights (lifters at or below 60kg) have a similar advantage, though it’s not quite as extreme.
Quite simply, there are more good lifters between 65 and 92.5kg, so when the Wilks formula was fitted to the data set, in order to make the scoring “fair” (theoretically giving each weight class an equal chance of producing the best lifter by Wilks Score), people in that weight range got the shaft. They need MORE relative strength than lifters lighter than 60kg, or heavier than 100kg, in order to achieve the same Wilks Score.
2. It’s not based on data that’s exclusive to raw or equipped lifting.
The IPF started allowing lifting gear in 1992. Since the Wilks formula is based on data from 1987-1994, it is based partially on data from lifters competing raw, and partially on data from lifters competing with early squat suits and bench shirts. Thus, a sizable portion of the data set used to calculate the Wilks formula is based on lifts performed with equipment that’s not allowed in raw lifting today. Furthermore (since Wilks is also used for the IPF single ply division), an even larger portion is based on lifts performed without the equipment that’s allowed in equipped lifting today, and the gear they DID have in 1992 doesn’t hold a candle to modern squat suits, bench shirts, and knee wraps.
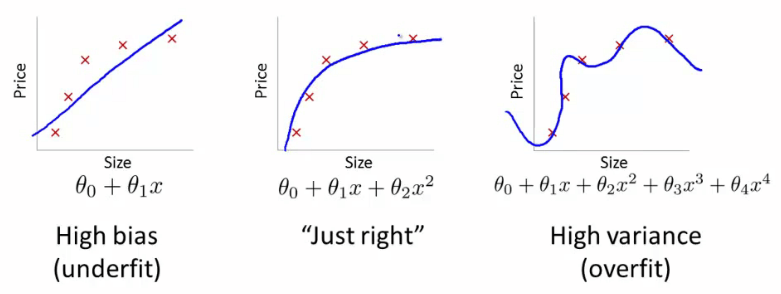
3. Overfitting
This is more of a theoretical gripe, but it’s still worth mentioning. Overfitting is a term used to describe a model that is prone to picking up the noise in a data set along with the actual relationship between the variables. There are only two variables in play here: strength and weight. Unless the relationship between those two variables changes in a chaotic manner, you shouldn’t need a fifth order polynomial (like Wilks) to describe the relationship between them. You can always add more and more exponents to make an equation fit a data set better and better, but the whole point of an equation like Wilks is to model the underlying relationship, not to fit the data set at all costs.
It doesn’t commit the cardinal sin of overfitting (having too complex of a model with too few data points to base it off of – pictured below), but it does seem to commit the second, lesser sin of assuming the data is the relationship instead of simply giving clues about the relationship.
Edwin Hubble’s work illustrates this issue beautifully. Here’s his elegant equation that describes how fast objects are moving away from us (and thus, indirectly, the rate of universal expansion):
![]()
And here’s the data set he used to arrive at that equation:
I heard a quote that summed this image up well (though, unfortunately, I can’t remember who from): “The genius of Hubble was that he saw this data and knew to draw a straight line through it.”
He could have drawn a looping curve though it to fit the data better, but that would imply that the rate of universal expansion was chaotic and unpredictable – faster in some places, and slower in others.
I think that’s the issue you see when looking at the Wilks formula: It accurately describes the data it’s based on, but in its complexity, it probably misses the true relationship between increases in strength and increases in weight.
If the purpose of the formula was to give each weight class an equal shot at producing the “best lifter” by formula, then the approach used to make the Wilks formula is a good way to go about it. However, if the purpose of the formula is truly to identify the best lifter and give lifters an accurate scale to compare relative strength across bodyweights, the sheer complicated-ness of it is a pretty good indication that it misses the mark. Quite frankly, in most meets, a middleweight lifter SHOULD win the best lifter award, because odds are that a middleweight will be the best lifter, just because there are more middleweights.
4. Static (not updated regularly)
Since the Wilks formula was introduced in 1994, it hasn’t been updated. That would be fine if lifters from 1987-1992 represented the absolute limits of performance in the sport of powerlifting, and if we could know that there would never be any shifts in dominant weight classes. However, neither of those are good assumptions.
In contrast, the Sinclair formula in weightlifting is updated every four years based on the top performances over the previous four-year time span. If you are going to scale performances based on competition data instead of using a basic physical relationship (like allometric scaling), especially in a sport that’s growing as quickly as powerlifting, the formula should be based on an up-to-date data set.
5. Based off totals
This isn’t necessarily a weakness of Wilks when it comes to bestowing a best lifter award at a powerlifting meet, but people are interested in comparing relative strength in individual lifts as well. The Wilks formula is based on totals, and it’s also been validated for the comparison of bench presses. However, it would be useful to have a formulas specifically made to compare individual lifts as well.
So, what should we do about it?
Funny you should ask. I’ve come up with two potential solutions.
The first is based on allometric scaling, and the second is based on competition data.
1. Allometric Scaling Score (ASS)
The score based on allometric scaling (Allometric Scaling Score, or ASS. The acronym is reason enough to use it) is simple. It’s SxM-2/3 multiplied by a coefficient so that the best score of all-time in a particular federation or manner of competition is equal to 100.
So, for example, for a raw squat performed in the IPF, that coefficient is 6.487682129. When you multiply that by the top raw allometric scaling score in raw IPF competition, the resultant score is 100. For any raw allometric scaling score less than approximately 15.41, you’d end up with a score of less than 100.
Personally, I’m partial to this approach. Allometric scaling is a perfect intersection of theory (based on a really basic biological relationship, it’s supposed to work) and practice (as I’ve already covered, it actually does work).
2. A simpler formula based on competition data
The score based on competition data (that I’m unabashedly calling the Nuckols Index) also takes a simple approach to comparing strength performances.
Remember how strength/bodyweight ratio for the world records decreased almost linearly as weight increased? Well, I looked to see how linear that decrease was. The answer? Pretty damn linear.
Here are two representative examples:
Here are the strength/bodyweight ratios for the untested bench press world records:
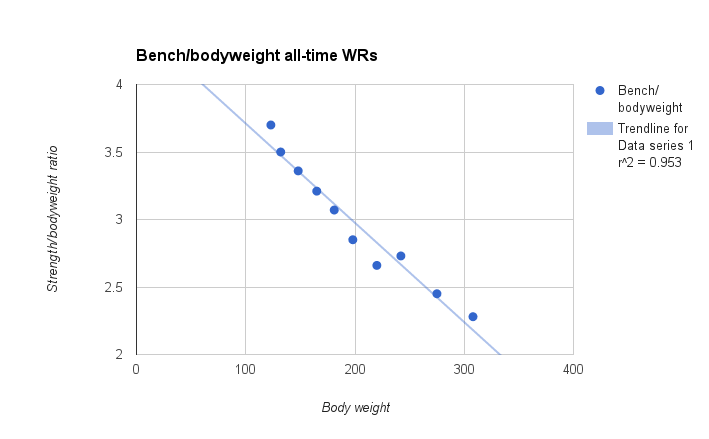
And here are the strength/bodyweight ratios for the IPF total world records:
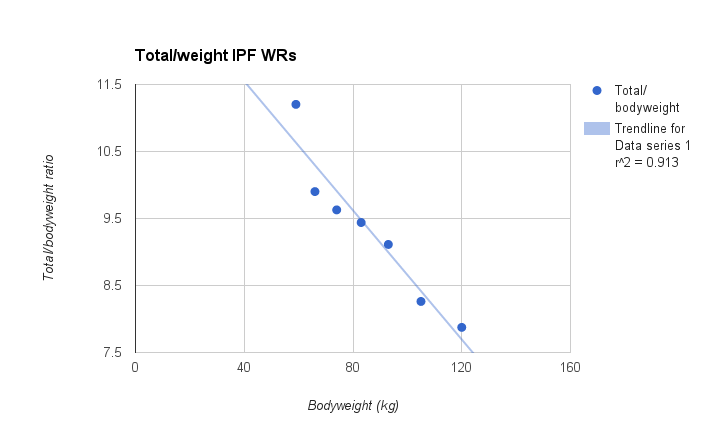
The r2s were really high (mostly 0.9+) across the board, with very few exceptions. One such exception is the all-time squat records. Stanaszek is such an outlier that he drags the r2 down to about .72. If you exclude him from the data set (which would be a perfectly legitimate thing to do with someone who’s such an outlier), the r2 for that data set goes up to around 0.85 as well. A few of the womens’ records also don’t give quite as pretty of a relationship, but I’m confident that will be remedied soon enough as the sport attracts more female competitors.
From these graphs, it was pretty easy to develop a formula that could compare performances up to the top capped weight class (308lbs for untested WRs, and 120kg for IPF world records).
The formula takes the form of 100*w/(a*bw2+b*bw). That may look a little messy, but it’s downright elegant compared to Wilks, which takes the form of 100*w/(a+b*bw+c*bw2+d*bw3+e*bw4+f*bw5)
w = weight lifted for a particular lift
bw = bodyweight
a and b are coefficients specific to the lift.
There are four main advantages of this approach over Wilks.
- It’s a much simpler equation (second order polynomial versus fifth order polynomial), so there’s probably a better chance that it reflects an actual underlying relationship, rather than picking up noise in the data set. Also, since there are fewer coefficients, it’s just a simpler equation to work with.
- It can be updated pretty easily to ensure it doesn’t go stale the same way Wilks has.
- Since it’s based only off world records, the effect of having a higher concentration of talent in certain weight classes doesn’t affect the results to nearly the same degree. It only takes one high performer at some point in time to “hold it down” for their weight class until another super high performer moves the world record up further. There’s the inherent disadvantage of fewer data points, but the tradeoff is that it helps remedy the issue of differing talent depths at each class screwing up the equation. There’s no clear bias toward any weight class or group of weight classes using this method. For the untested records, the top 3 scores (across squat, bench, deadlift, and total) are held by two 123s, one 132, two 198s, two 220s, one 242, two 275s, and two 308s. For the IPF world records, it’s three 59s, one 66, two 74s, three 93s, and two 120s.
- It can be used to assess relative strength in the total, but also in each of the individual lifts.
Here’s how this method fares for the IPF records:
| Weight class | Squat | Squat Nuckols Index | Bench | Bench Nuckols Index | Deadlift | Deadlift Nuckols Index | Total | Total Nuckols Index |
| 59 | 226 | 98.23 | 170 | 92.59 | 270.5 | 94.35 | 661 | 100 |
| 66 | 240.5 | 95.48 | 182.5 | 92.37 | 278 | 89.55 | 653.5 | 90.80 |
| 74 | 260 | 94.52 | 210.5 | 100 | 310.5 | 93.40 | 712.5 | 91.77 |
| 83 | 280.5 | 93.75 | 205 | 91.26 | 316 | 88.84 | 783.5 | 94.19 |
| 93 | 303 | 93.67 | 232.5 | 99.04 | 372.5 | 100 | 847.5 | 95.87 |
| 105 | 330 | 94.54 | 221.5 | 90.41 | 343 | 87.22 | 867.5 | 92.68 |
| 120 | 375 | 100 | 235 | 94.49 | 371.5 | 92.13 | 945 | 96.81 |
And the untested world records:
| Weight Class | Squat (with wraps) | Squat Nuckols Index | Bench | Bench Nuckols Index | Deadlift | Deadlift Nuckols Index | Total (with wraps) | Total Nuckols Index |
| 123 | 639 | 100 | 455 | 100 | 634 | 97.56 | 1339 | 93.87 |
| 132 | 565 | 81.51 | 462 | 96.26 | 628 | 91.49 | 1471 | 97.58 |
| 148 | 611 | 80.49 | 498 | 95.77 | 697 | 94.17 | 1581 | 95.85 |
| 165 | 710 | 87.10 | 529 | 94.73 | 717 | 90.26 | 1714 | 95.79 |
| 181 | 744 | 85.21 | 556 | 94.17 | 791 | 94.80 | 1840 | 96.28 |
| 198 | 810 | 87.59 | 565 | 91.00 | 870 | 100 | 2028 | 100 |
| 220 | 915 | 93.27 | 586 | 89.74 | 901 | 98.97 | 2110 | 97.23 |
| 242 | 881 | 83.91 | 661 | 98.00 | 893 | 94.85 | 2210 | 96.35 |
| 275 | 992 | 89.31 | 675 | 96.84 | 906 | 94.04 | 2380 | 97.35 |
| 308 | 1030 | 88.53 | 701 | 99.92 | 939 | 98.19 | 2425 | 94.68 |
However, this method has a major flaw. Since it’s based on a strength/bodyweight ratio, the bigger a lifter gets, the smaller their strength/bodyweight ratio is expected to be (since it’s expected to decrease linearly). It’s obvious that this isn’t a major concern up to 308lbs for untested lifts, or up to 120kg for IPF lifts. However, if you tested it for, say, a 300kg lifter, they’d achieve GOAT status (a score exceeding 100, setting the new standard) with a squat around 600lbs in an untested meet (lower than the current 308 world record), and about 260kg in an IPF raw meet since their strength/bodyweight ratio would be expected to be less than 1.
So, past the top of the weight-capped classes, you can compensate by having allometric scaling take over, with the allometric scaling score intersecting the lift at 308 or 120 that would provide a Nuckols Index score of 100 (how to do that is described in the attached spreadsheet at the end of the article).
Let me reiterate that my preference is for allometric scaling. The Nuckols Index is, I think, a better option than Wilks if you insist on having a standard that makes recourse to competition results. However, it incorporates allometric scaling anyways for larger lifters, and allometric scaling also has the advantage of strong theoretical support.
Using both of these methods, however, there’s still one group left high and dry: superheavyweights.
However, I think that’s for the best.
Why?
Because ultimately, the best lifter award ought to be awarded to the person with the most relative strength because, after all, powerlifting is a sport of relative strength – how much you lift relative to how much you weigh. You should realize by now that relative strength isn’t as straightforward as taking a simple ratio of how much you lift divided by how much you weigh. However, the basic principle at the heart of relative strength is that if you’re comparing two people who are equally skilled with similar body fat percentages (within 5-10% or so), they should have similar relative strength. And, quite frankly, superheavyweights generally have quite a bit more body fat than the top competitors in the weight-capped categories. As we saw, only the lightest superheavyweight with an all-time record (Ilyes Boughalem) still had an allometric scaling score that was competitive with the record holders in weight-capped categories.
So I say, let the superheavyweights dominate absolute strength, but if a SHW wants to compete in terms of relative strength, they should be expected to have a similar body fat percentage as the top competitors in the other weight classes, instead of being advantaged by a formula like Wilks.
To recap:
- There’s way more to relative strength than taking a simple ratio of how much you lift divided by how much you weigh.
- Because of the factors that regulate how much you weigh and how much you lift, allometric scaling provides an ideal means to compare relative strength. It has strong theoretical support and real-world validation.
- Because of how the Wilks formula was developed, it’s biased against normal-sized lifters, and gives a clear advantage to very light and very heavy lifters. Furthermore, if a formula similar to Wilks is to be used, it should at least be updated regularly.
- If you want to use an allometric scaling score to compare relative strength to determine the most impressive powerlifter, that’s great. If you want to use my formula that’s population-specific, lift-specific, and based on continuously updated world records, that’s great. However, both a simple strength/bodyweight ratio and the Wilks formula are deeply flawed, and we need something better to take their place.
- Superheavyweights will be screwed by any reasonable formula used to compare relative strength. However, that’s actually a good thing by my estimation: Increased body fat levels inherently decrease relative strength, and SHWs shouldn’t get a “free pass.” If they want to compete in terms of relative strength, they should be expected to maintain body fat levels similar to the lifters in the weight-capped classes. Otherwise, they can just own the category of absolute strength (which is what the SHW class is for in the first place), and leave relative strength for the rest of us. I realize that this is a value judgement and may strike some people as unfair, but, to me, it seems more unfair to give the SHWs a boost as large as Wilks does. If a 150kg lifter has the same allometric scaling score as a 72.5kg lifter, their Wilks score will be 23% higher. By the time a lifter is 180kg, the advantage jumps to 35%.
If you’re interested in seeing how you score with each of these methods and how you stack up against the best in world, check out this spreadsheet (you need to download it to be able to edit it) with more information. It also contains the data for female lifters and single-ply lifters.
So, to wrap it all up, the answer to the question posed in the title of this article really depends on how you assess relative strength. Unfortunately, there’s no simple answer. By any measure of relative strength, Stanaszek’s squat, Gant’s deadlift, and Othman’s bench are the three greatest displays of relative strength in those lifts. But who’s the greatest all-around powerlifter? It’s hard to say for sure because the answer will depend on the tools you use to go about answering it. However, this article has given you a few more tools you can use to compare relative strength in an attempt to answer that question for yourself.
Share this on Facebook and join in the conversation
• • •
Next: The Complete Strength Training Guide →
The New Approach to Training Volume →