

Note: This article was the MASS Research Review cover story for July 2022. If you want more content like this, subscribe to MASS.
Getting really lean is a common goal, which a fair number of people regularly achieve, and it’s easy to find trainers and books to help you do so. However, getting lean and staying lean is often viewed as a holy grail, at least in bodybuilding-centric circles. People pursue this goal for many reasons, and it’s something many can relate to. As a bodybuilder and fan of bodybuilding, I’m awestruck by physiques lean enough to display all the anatomical muscular details of the human body. Thus, when I go through the grueling process of contest prep to get shredded, there’s always a part of me that wonders if maybe I could stay shredded, or at least stay something close to shredded. If you look around the fitness industry, and see what people buy, click on, and try, it’s apparent I’m not alone.
The question is, why is it so hard for people to stay shredded once they get there? Speaking generally, regardless of the end-point body composition achieved, the difficulty of maintaining clinically meaningful, long-term weight loss is well established (1). For those interested in learning how difficult it is (and why), I highly recommend reading Dr. Ben House’s excellent, in-depth MASS guest article (MASS subscription required) on this topic. However, while Dr. House’s review covers a related question, the present article isn’t about how hard it is to maintain weight loss. Rather, it specifically addresses the question of whether it’s sustainable to maintain a very low body fat.
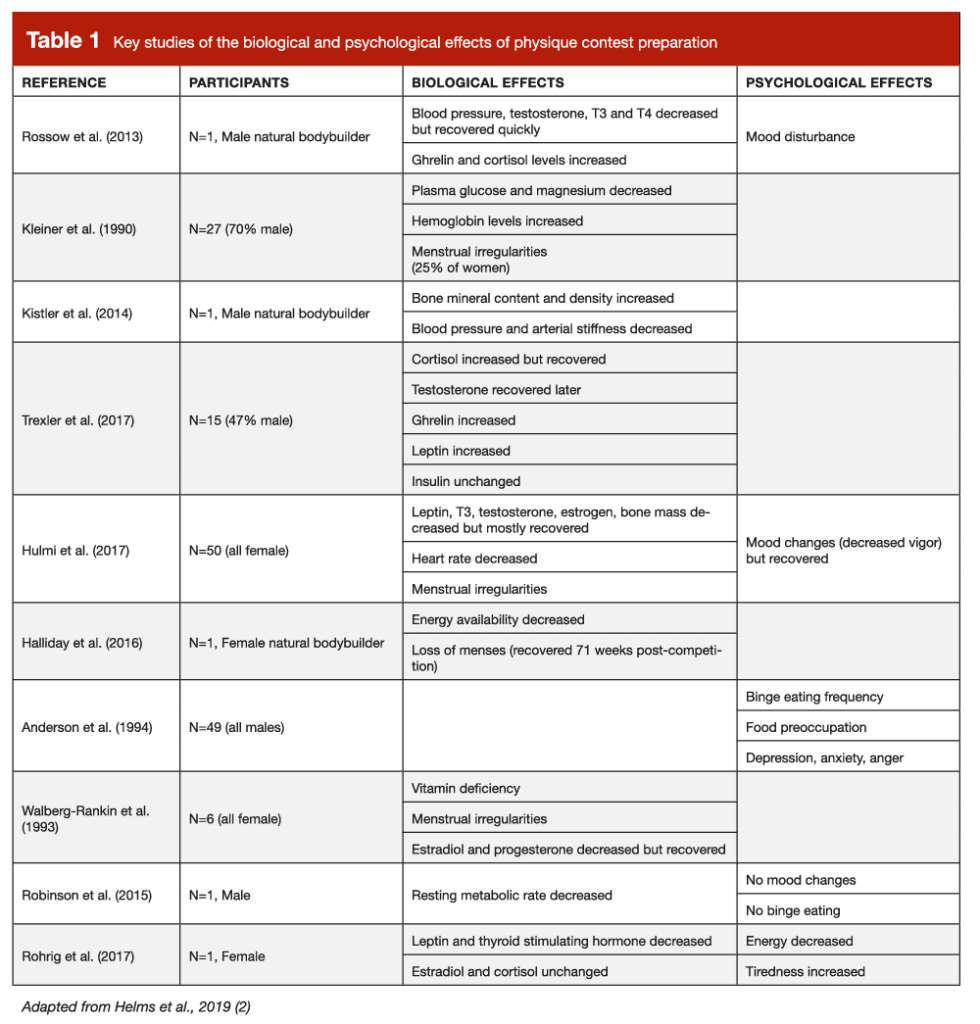
To discuss sustainability, however, I must acknowledge the subjectivity of the word. Everyone can technically sustain an extremely low level of body fat. Hypothetically, if you were locked in a room and only fed sufficient energy to lose weight until you got to essential levels of body fat, and then subsequently only fed enough to maintain those levels of body fat, you’d sustain a shredded physique. Whether or not you’d have full physiological functionality doing so, and whether you’d enjoy the experience enough for it to be worth it, however, are the more relevant questions. Indeed, if you’ve ever spoken to bodybuilders, they almost universally express sentiments of how difficult it is to get shredded for competition. At 3DMJ, we’ve collectively prepped thousands of drug free physique competitors in the last decade, and we’ve been intimately involved in bodybuilding culture. When discussions of contest prep come up, we hear the same anecdotal reports time and time again of how it gets harder and harder as the weeks pass. Physique athletes report getting hungrier, more food focused, lethargic, tired, and irritable, and veterans notice they seem to get ill and injured more frequently as they get leaner. Indeed, many of these anecdotal experiences are mirrored in studies of physique competitors during contest preparation and recovery. A collection of these findings are shown in Table 1, adapted from a review I led on the challenge of making physique sport a sustainable practice (2). However, it’s difficult to parse out whether these experiences and observations are caused by the state of being really lean, the process of getting really lean, or a combination of the two.
Energy availability and RED-S
To better understand the causes of the negative symptoms associated with getting really lean, we must discuss “relative energy deficiency in sport” (RED-S). RED-S describes the “impaired physiological functioning caused by relative energy deficiency, and includes but is not limited to impairments of metabolic rate, menstrual function, bone health, immunity, protein synthesis, and cardiovascular health” (3). Importantly, research directly links RED-S to being in a chronic state of low energy availability, defined as the amount of calories consumed relative to lean body mass (LBM) when taking exercise activity into account. Mathematically, this is expressed as: (total energy intake – exercise expenditure) / LBM. If this value gets too low, athletes experience increased prevalence of RED-S symptoms. As reviewed by Anne Loucks (4, 5), a seminal researcher in this field, signs of metabolic and reproductive hormonal downregulation associated with RED-S are observed in diverse populations from lean, male Army Rangers during training, to exercising and sedentary normal weight women, to women with obesity undergoing rapid weight loss, when energy availability falls below ~30kcal/kg of LBM/day through any combination of increased exercise energy expenditure and/or decreased energy intake.
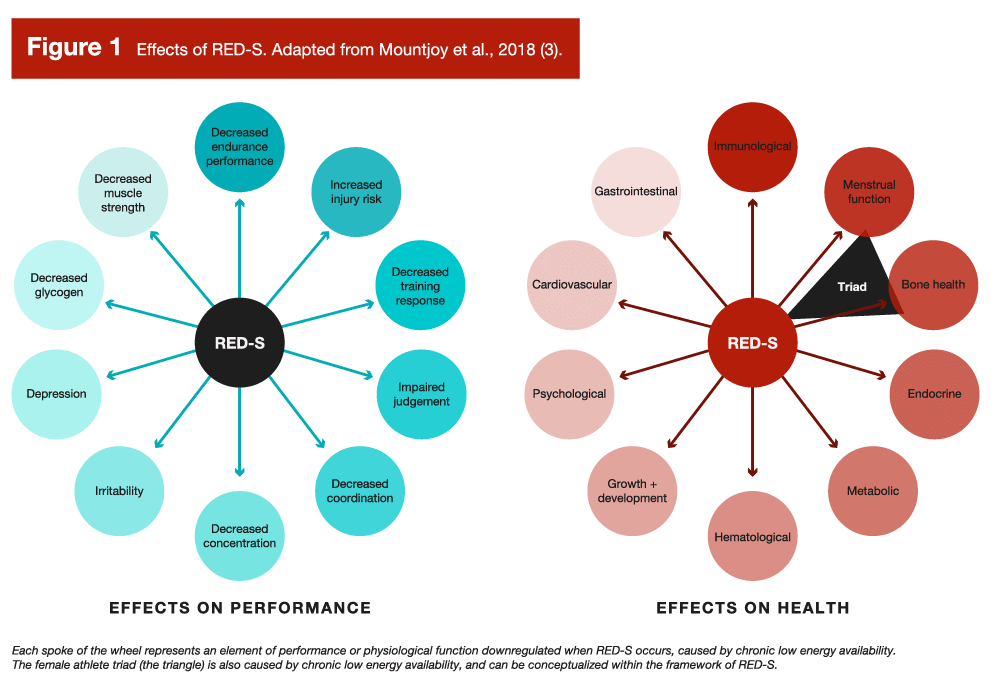
While 30kcal/kg/LBM/day is a decent rule of thumb to keep in mind, it should not be seen as a universal threshold that applies to all (6). Furthermore, most physique athletes in my experience simply won’t get into adequate contest shape without going lower than 30kcal/kg of LBM/day at a certain point, and even if you can stay above it, there is substantial individual variation as to when symptoms of RED-S crop up (in many cases, the threshold among athletes is higher, in the 30-45kcal/kg of LBM/day range). Differences in baseline non-exercise activity, one’s composition of LBM, and other individual physiological differences cause the appropriate energy availability for a given person to vary (6). Regardless of where an individual’s threshold for low energy availability lies, you can view going below it as there not being enough “left over” energy for physiological function. When this continues chronically, adaptive downregulation across various aspects of physiology occur, which can impact performance and health (Figure 1).
RED-S is relatively common among athletes with a high energy output, such as endurance athletes, or among athletes who are likely to restrict energy intake (3), such as physique athletes, weight class athletes, or athletes who benefit from a high power-to-weight ratio. When reflecting on the effects of RED-S and how energy availability is calculated, you might notice two things: 1) RED-S symptoms line up with the experiences of bodybuilders during contest prep, and 2) body fatness is not part of the energy availability equation. So, does this mean if a bodybuilder was to diet down to stage condition, then simply increase their calories or decrease their training energy expenditure to get out of a deficit, they’d be able to avoid all the RED-S symptoms and stay lean consequence free? Well, despite the current understanding that the singular cause of RED-S is low energy availability, independent of leanness, it is a little more complicated than that.
Adaptive thermogenesis
Stronger By Science and MASS readers are likely more familiar with the concept of metabolic adaptation, known more commonly in the literature as “adaptive thermogenesis,” than they are with RED-S and energy availability. Briefly, adaptive thermogenesis refers to a reduction in total energy expenditure following weight loss (or the increase following weight gain) beyond what would be predicted by changes in body composition (7, 8). For a deep dive, Dr. Trexler has a fantastic article that outlines its mechanisms and how to address it while dieting, and during maintenance post-diet. While the study of adaptive thermogenesis is distinct from the study of low energy availability, the two fields are interrelated and describe the same phenomena from different perspectives. The fitness industry focuses on adaptive thermogenesis because this research has been around longer and it attempts to understand how reductions in energy expenditure manifest, and how they impact efforts to lose weight and maintain weight loss. This lines up with the interests of the fitness industry, while low energy availability research doesn’t line up quite as well, as it addresses how to adequately fuel athletes for health and performance.
Since adaptive thermogenesis is studied in relation to weight loss, the focus is on energy balance, rather than energy availability. People often have a difficult time conceptually integrating the two concepts, especially if they are new to the latter. The way to understand the link between the two is to consider the effects of adaptive thermogenesis beyond the simple quantitative reduction in energy expenditure. The causes of reduced energy expenditure are due to reduced sympathetic and increased parasympathetic nervous system tone and downregulation of the hypothalamic pituitary-thyroid and -gonadal axes, resulting in decreases in heart rate, thyroid hormone production, increases in skeletal muscle work efficiency at low intensities, decreases in non-exercise activity expenditure, and reductions in sex hormone production (8). But these physiological changes don’t just reduce energy expenditure in a vacuum. Many of these changes also cause the symptoms associated with RED-S. Adaptive thermogenesis describes the degree to which the downregulation of physiological systems impacts energy expenditure, while RED-S describes how the downregulation impacts health and performance.
Importantly, you can be at energy balance while being in a state of low energy availability and experiencing symptoms of RED-S. Unfortunately, adaptive thermogenesis doesn’t only occur during weight loss, but can persist during weight maintenance. In a classic study by Rosenbaum (7), seven trios of weight and sex matched participants spanning a range of bodyweights were compared. Each trio consisted of a participant who had lost at least 10% of their bodyweight and was maintaining that loss for 5-8 weeks, a participant who had lost at least 10% of their bodyweight and was maintaining it for at least a year, and a participant at their usual weight. Total energy expenditure was significantly lower among the weight-reduced participants compared to the participants at their usual weight, regardless of whether the weight loss had been maintained for 5-8 weeks, or a year or longer. Further, the reductions in energy expenditure were similar between the two weight-reduced groups. This seems to be a consistent trend when assessing the literature broadly (8), as 10% weight-reduced study participants display a ~15% lower total daily energy expenditure on average compared to their non-weight-reduced counterparts.
Considering the above, let’s do a little bit of math. Using this calculator (9), a 170cm (~5’6”), 70kg (~154lbs), 25 year old, very lean woman at 12% body fat, who performs moderate exercise 4-5 days per week, has an estimated daily energy expenditure of 2491kcals. If she was sedentary, she would instead have an expenditure of 2041kcals; the difference between these two values can be used to represent her average exercise energy expenditure of 450kcals per day. If this woman was previously 77kg, and had lost 10% of her bodyweight to reach 70kg, we could reasonably expect a ~15% reduction in energy expenditure based on the literature. Thus, her daily energy expenditure of 2491kcals would instead be ~2117kcals. At 70kg and 12% body fat, she has 61.6kg of LBM. Thus, if she was eating at maintenance following weight loss, we could calculate her energy availability using the previously mentioned equation ([total energy intake – exercise expenditure] / LBM) as follows: (2117kcals – 450kcals) / 61.6kg = 27.1kcal/kg of LBM/day.
As you can see, this intake, despite being her maintenance calories, is below the ~30kcal/kg of LBM/day average threshold for low energy availability where we’d anticipate symptoms of RED-S would occur.
Certainly, not everyone experiences a 15% reduction in total energy expenditure after weight loss; some experience less, some more. But, on average, if we accept the current understanding that energy availability is the sole cause of RED-S with no influence of body composition, it seems unlikely that the majority of individuals would be able to maintain a very low body fat after weight loss without experiencing some symptoms of RED-S. However, this begs the question: if it just comes down to energy availability, and body fat doesn’t enter the equation, why does physiological function remain downregulated in weight-reduced individuals in the first place?
Body fat “set points” and leptin
To answer the question I just posed, I don’t think it comes down to energy availability exclusively. I think body fat plays a role, and it’s hard to think otherwise when you understand the physiology at play. If you’ve observed discussions on dieting in the evidence-based fitness space, you might have heard the concept of a “body fat set point.” Generally, the idea is that people have a level of body fat that is “defended” (i.e., adaptive thermogenesis occurs) when fat loss takes you below it, or when fat gain takes you above it. This concept originated from scientific research that’s been ongoing for the better part of 70 years. Indeed, the set point concept describes the original “lipostatic” model of body weight regulation proposed by Kennedy in 1953 (10). This model states that, like a thermostat, adipose tissue sends signals to the brain indicating whether body fat stores are below, at, or above a person’s body fat set point. In response, the brain sends signals to downregulate, maintain, or upregulate energy expenditure, and increase, maintain, or decrease energy intake, respectively, to get back to the body fat set point. This model was largely theoretical until the discovery of leptin in the 1990s (11), a hormone that seemed to act as the proposed signal from the lipostatic model.
Leptin is a hormone secreted by adipose tissue in proportion to the amount of adipose tissue present (12), and, in initial animal models, leptin would decrease with weight loss, increase with weight gain, and returned to baseline when animals compensatorily increased or decreased food intake following these states to return to a seeming “set point” (13). However, the pure lipostatic model has a lot of problems, and is not the current model used to understand body weight regulation. From an observational perspective, the lipostatic model fails to explain the obesity epidemic, and from a mechanistic perspective, leptin doesn’t behave exactly like the lipostatic model’s signal is supposed to. Specifically, it seems leptin release from adipose tissue is impacted by metabolic hormones, such as insulin and others, that respond acutely to feeding and fasting (14). Leptin decreases precipitously upon the initiation of fasting, and this response precedes (and is disproportionate to) changes in body fat. Further, as research on leptin continued, it was discovered that, while leptin is primarily produced by adipose tissue (15), it is produced (and there are receptors for it) in other tissues as well, notably the stomach. Gastrically produced leptin is thought to be a signaller of short-term energy availability, while adipose tissue derived leptin may act as a long term signal of energy availability (16). Indeed, changes in macronutrients and energy intake can acutely change leptin (17). Also out of step with the lipostatic model is that leptin is much more effective at encouraging weight gain when levels are low, as opposed to encouraging weight loss when levels are high. Indeed, circulating leptin is quite high in those with common forms of obesity, but does not suppress excess energy consumption enough to cause weight loss (18).
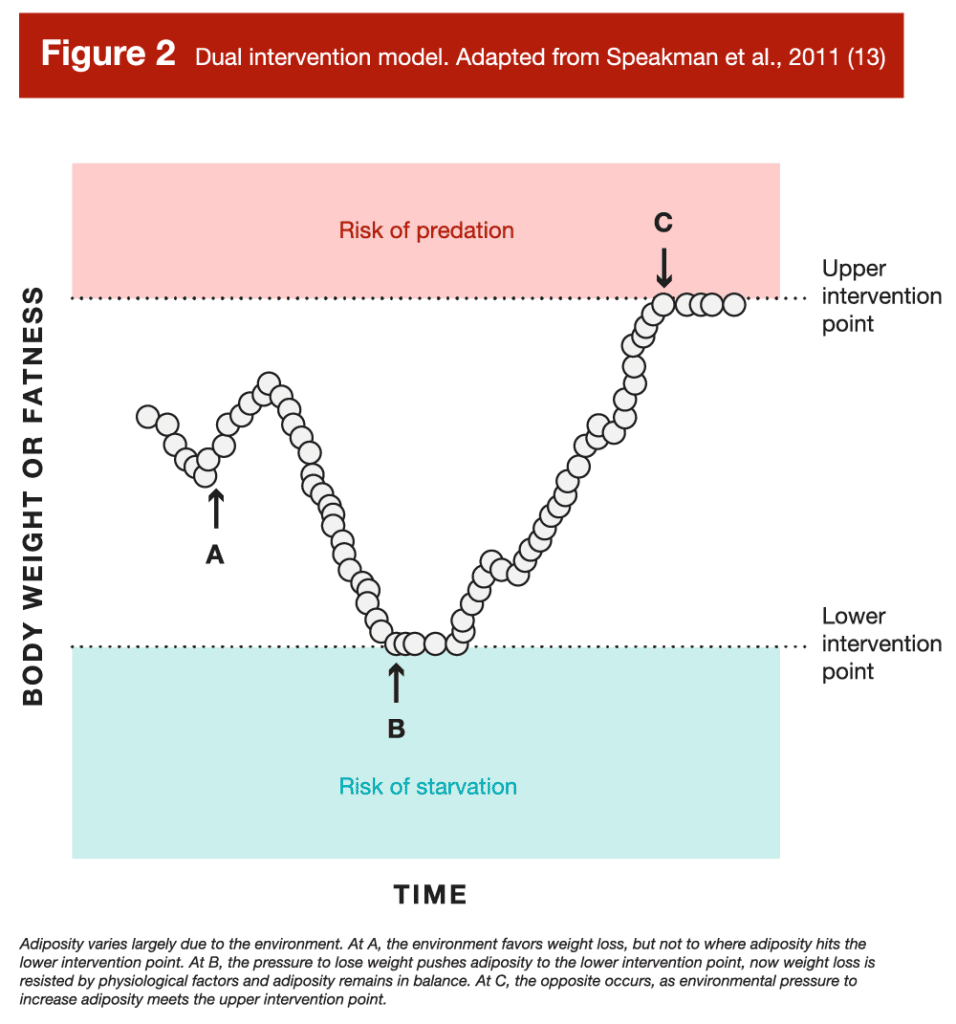
As reviewed by Speakman and colleagues (13; notably this is open access and very informative), to account for these observations and complexities, the “dual-intervention model” of body weight regulation was eventually proposed, which arguably is the best fit for the currently available data. It accounts for environmental factors that can overcome physiological set points, which lines up with the obesity epidemic and the nuances of leptin physiology. As shown in Figure 3, there are upper and lower points where physiological factors primarily influence energy intake and expenditure, modifying adiposity. Between these points, however, environmental factors dominate. These upper and lower points are thought to exist due to evolutionary predation and famine selection pressures (i.e., being too heavy and slow made you more likely to be eaten, being too lean made you more vulnerable to famine), respectively (13). Arguably, the latter was a greater threat to humans, resulting in a better defended lower intervention point, hence the struggles many have with weight gain and regain.
This model provides hope for those interested in maintaining a lower body fat. Based on the model, if you can modify your environment to do the opposite of what the modern, obesogenic environment has done to our collective waist lines, you should be able to hang out closer to your lower, rather than your upper, intervention point. In fact, by examining people living in a non-modern environment, we can see this is probably the case. One such group, the Amish, live in traditionalist communities that typically don’t adopt most conveniences of modern technology. Bassett and colleagues (19) examined the physical activity and body composition of a sample of 98 Amish men and women from a community in Ontario that did not use electricity or gas power, and of whom the majority of men were farmers (78%) and the majority of women were homemakers (69%). The researchers gave the Amish participants pedometers to track their step count, and assessed their body composition via bioelectrical impedance measurements. In this agricultural community, they made their own food, and the requisite activity levels for day-to-day work were very high compared to modern standards. The men walked an average of 18,425 ± 4,685 steps per day, and the women an average of 14,196 ± 4,078. Interestingly, the men had an average body fat percentage of 9.4 ± 4.3%, and the women an average of 25.3 ± 6.7%. Importantly, these are bioimpedance measurements, so they aren’t as accurate or reliable, even at the group level, as alternative measurement options like DXA. However, with a sample of nearly 100 individuals, they are likely close to the true values. Notably, the more active men were maintaining, on average, a single digit body fat percentage. The women weren’t as lean relatively, even taking sex differences into account (the rough female equivalent to a male at ~9-10% body fat is ~17-18%), and also weren’t as active. While it’s tempting to isolate this difference in body fat percentage to the men being more active, it’s not as though the women weren’t reasonably active as well. Rather, other cultural or environmental aspects were likely at play, which led to the women being relatively higher in body fat (for example, the authors noted Amish women have an average of seven children, which can result in a higher average body fat). So, if we assume the men didn’t have RED-S – a reasonable assumption as the community had an ample food supply (earlier research on Amish men reports a daily energy intake of ~3600kcal/day [20]) and they weren’t athletes trying to stay lean – this suggests your environment plays a major role in how lean you stay. In support of this contention, decreases in sedentary activity (21) and ultra-processed food consumption (22) can lead to maintaining lower body fat levels. However, it’s important to point out that 9.4 ± 4.3% body fat is not 5 ± 1% body fat. These Amish dudes are lean, some more and some less than others, but on average they aren’t ready to don posing trunks to show off their striated glutes.
Putting it all together
If we put these models and observational data together, we can construct a relatively clear, albeit simplified (23), theoretical explanation of what determines the level of leanness you can sustainably maintain. Starting with the dual intervention model as the backdrop, when you are between your lower and upper intervention points of adiposity, you’ll likely feel fine. However, bringing in the RED-S model, this is only true until you reduce your energy intake or increase your energy expenditure to the point where you reach your threshold for low energy availability. When this happens, regardless of where your body fat level is between your intervention points, RED-S and adaptive thermogenesis may occur. However, if you can manipulate your body fat gradually, so that you don’t reduce energy intake to the point where you reach a state of low energy availability, you can mitigate adaptive thermogenesis and symptoms of RED-S. That is, until you pass your lower intervention point, which is where body fat comes into the picture.
As discussed, leptin transiently fluctuates in response to meals and acute changes in energy balance, and each time you eat you can get a nice bump in leptin. However, the largest contributor to your circulating leptin levels is far and away fat mass. To put a specific number to it, Considine and colleagues reported a strong correlation (r = 0.85, p < 0.001) between serum leptin and body fat percentage across a combined sample of 136 normal-weight participants and 139 participants with obesity (12). Meaning, in this large, diverse sample, body fat percentage explained ~72% of the variance in leptin. Thus, even if you’re eating at maintenance, when you’re between meals (which is most of the day), your leptin will fall to low levels when below your lower intervention point. As a consequence, total energy expenditure will remain suppressed, keeping you in a state of low energy availability, leading to symptoms of RED-S. Indeed, we can’t discount the important effect of chronic leptin levels; the only known intervention besides regaining lost body fat that alleviates adaptive thermogenesis (and likely RED-S symptoms for some) in weight-reduced individuals are multiple daily leptin injections (8).
I know what some of you are thinking: “But Eric, I know some people who walk around shredded who are just fine!” So do I, and this still lines up with the theoretical understanding I’ve proposed. Importantly, there is a ton of individual variation at play. Individual variation exists in where one’s lower intervention point is (some people have a leaner lower end point), the energy threshold for when RED-S symptoms crop up (some people do okay at lower values), and whether and how much a person experiences adaptive thermogenesis during and after weight loss (some people don’t experience much at all). Thus, you’ll see people who maintain a variety of different body fat levels, despite living in similar environments. For example, not everyone in our modern obesogenic environment has obesity. Likewise, the Amish men had a body fat standard deviation of 4.3%, meaning (if we trust the bioelectrical impedance measurements) some were walking around at 5% body fat, but just as many were walking around at 14% (maybe; 24).
Also consider that when there are strong rewards at play, people might be okay with living with mild or even moderate RED-S symptoms. In a prior MASS article, I reviewed a paper on energy availability in a group of elite female sprinters who were maintaining reasonably lean (~20% body fat) physiques (article; 25). Interestingly, the sprinters with more indicators of low energy availability had higher fat mass (13.0 ± 2.3kg vs. 11.2 ± 1.6kg, p = 0.03) compared to the leaner sprinters with fewer indicators. While speculative, I guessed this was due to the selection pressures of being an elite sprinter, where having less fat mass means you can run faster. Thus, there were those with a lower intervention point at a lower body fat level who were able to stay leaner without issue, while the rest who weren’t so lucky had to stay in a perpetual weight-reduced, low energy availability state to stay lean (but not quite as lean). Simply put, athletes like to win, and they are often okay with some health and comfort trade-offs if being leaner will improve their performance (I would also note that influencers like your money and attention, and being leaner helps them get that too). This is why athletes in sports where a lower body fat improves performance tend to be leaner (26), and, while many of these athletes have the genetics to be naturally lean, not all of them do, which is why athletes in these sports are also more likely to experience RED-S (2).
Testing the hypothesis that body fat matters
We can assess the veracity of the theoretical explanation I’ve presented that it’s not just energy availability, but also your lower body fat intervention point that dictates how lean you can maintain. If body fat played no role, and it just came down to energy availability, you’d expect dieting to impact people in similar ways, regardless of their body fat level when starting the diet, but it doesn’t. For example, authors of a recently published meta-analysis reported that caloric restriction resulted in an increase in testosterone in the majority of studies on men with overweight or obesity, while the majority of studies on men with normal weight reported a decrease (27). Likewise, muscle protein synthesis is blunted during an energy deficit in overweight dieters (28), but, in lean dieters, not only is protein synthesis blunted, but protein breakdown increases as well (29). Furthermore, lean individuals utilize two to three fold more energy from protein when fasting compared to individuals with obesity (30) and are more likely to lose lean mass while dieting (31).
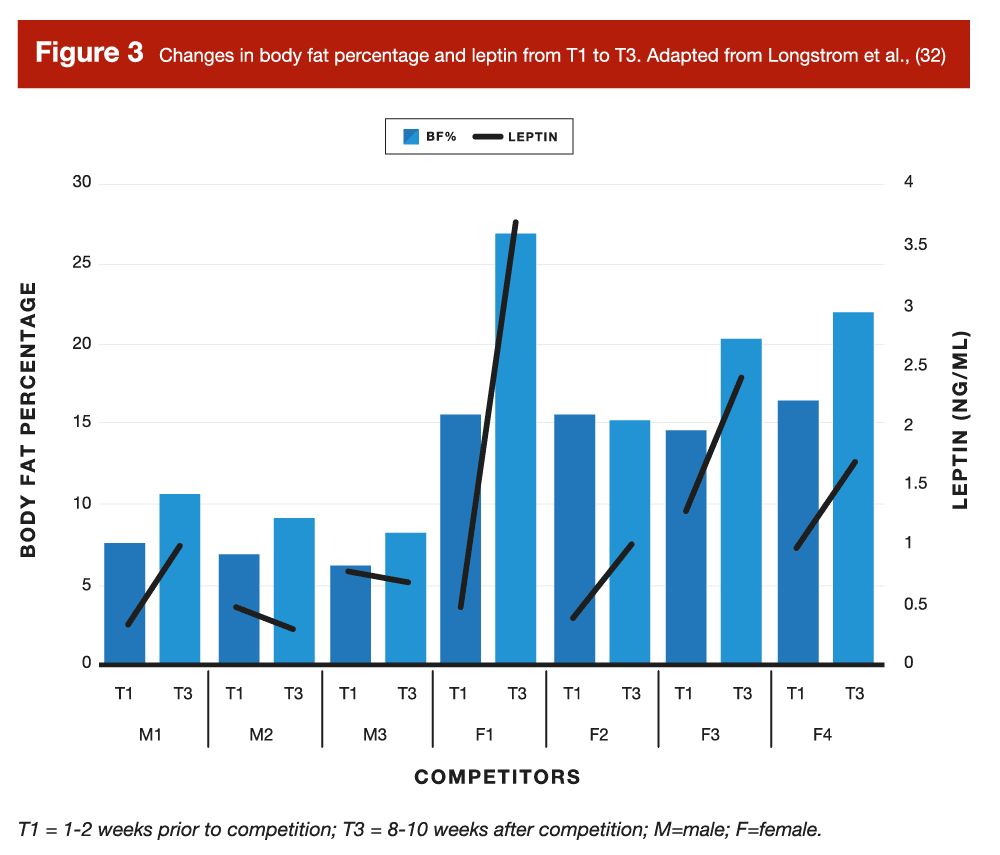
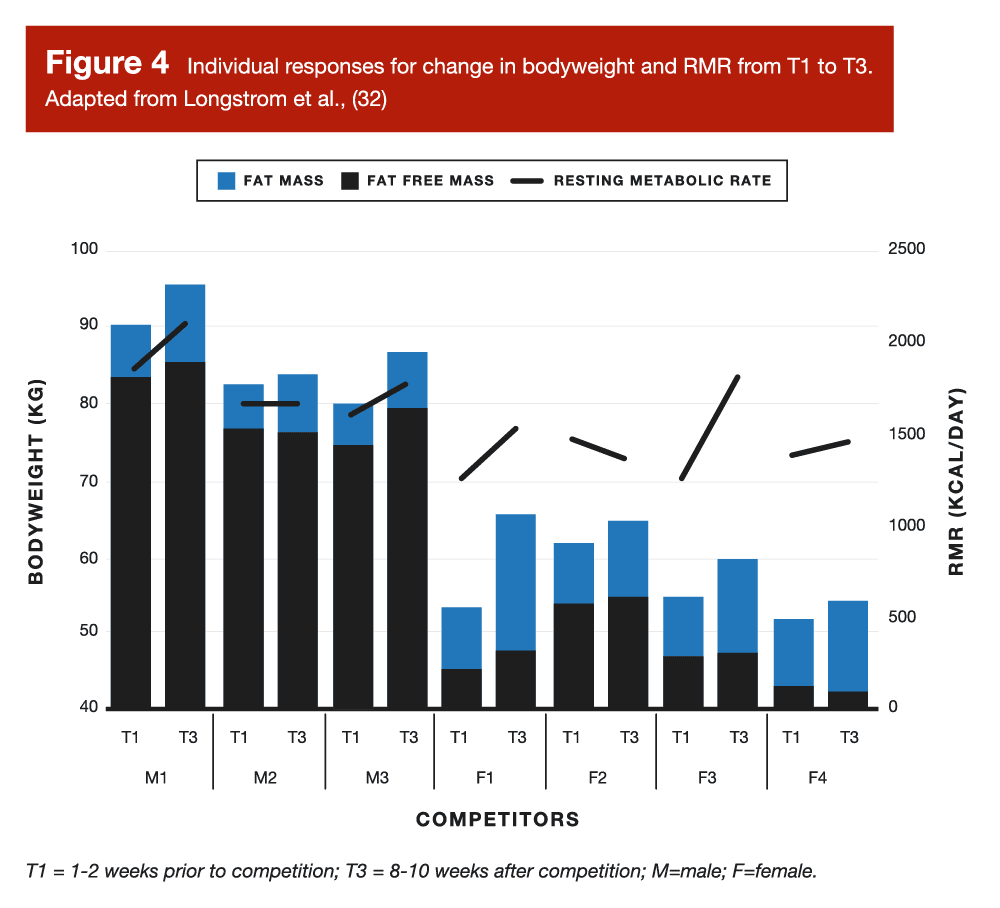
However, the most direct evidence we have to test my hypothesis that body fat matters are observations of what happens when people get very lean, and then try to stay very lean. In a case series on physique athletes by Longstrom and colleagues, some of the competitors did just that, following conservative “reverse diets” to minimize fat gain post-contest by slowly increasing calories and decreasing cardio (32). Longstrom measured body composition and metabolic hormones 1-2 weeks prior to competition, as well as 8-10 weeks post-contest once the competitors had carried out their post competition strategies. Generally, Longstrom reported that those who increased fat and body mass the most experienced larger increases in leptin and resting metabolic rate, while smaller increases or no changes occurred in those who gained very little fat and body mass.
If you examine Figures 3 and 4 from this study, you can see that two of the male competitors (M1 and M2) only increased their body fat by ~2%, staying below 10% body fat even 8-10 weeks post competition. Likewise, one female competitor (F4) increased her body fat by just 2.7%, only getting up to ~15% body fat 8-10 weeks post show, which was the body fat that the other three females achieved at the end of their diets. Notably, these two male competitors experienced no appreciable change in leptin, and F2 had the lowest leptin value of the female competitors. Likewise, resting metabolic rate only slightly increased (M3), stayed the same (M2), or slightly decreased (F2) among these competitors. Finally, at the group level, the observations were also consistent with the hypothesis that fat mass does indeed play a role in hormonal and metabolic recovery. The change in fat mass was strongly associated (33) with the change in resting metabolic rate (τ = 0.90; p = 0.001) and the change in body fat percentage was strongly associated with changes in leptin (τ = 0.88; p = 0.003).
Takeaways
It’s difficult to piece together complex, distinct lines of research on how humans adapt to changes in short and long term energy availability. Different models tell a piece of the story, but not all of it.
A pure focus on low energy availability can lead one to think that body fat plays no role in the symptoms we associate with RED-S, but effectively ignores ~70 years of research on body composition regulation.
Similarly, a pure focus on adaptive thermogenesis can neglect the effect of these adaptations on health and performance, focusing only on how it changes energy expenditure.
In totality, it’s likely that energy availability is the dominant variable impacting your physiology when you’re between your upper and lower body fat intervention points. However, when you go below your lower intervention point, you’ll be persistently fought by your body and you probably won’t be able to get your calories high enough (without fat gain) to alleviate the negative effects you experience.
With that said, some people can stay really lean, as they happen to have a leaner lower intervention point. For those of us that are not so lucky, that doesn’t mean all hope is lost. Rather, it just means that we have to respect wherever our lower intervention points might be.
Further, you can do all the things we’ve talked about time and time again (like eating sufficient protein and lots of low energy density, high fiber fruits and vegetables, increasing activity and reducing sedentary time, reducing ultra-processed and highly palatable food intake, and of course, lifting lots of weights) to modify your environment so you can stay close to it.
Get more articles like this
This article was the cover story for the July 2022 issue of MASS Research Review. If you’d like to read the full, 130-page July issue (and dive into the MASS archives), you can subscribe to MASS here.
Subscribers get a new edition of MASS each month. Each edition is available on our member website as well as in a beautiful, magazine-style PDF and contains at least 5 full-length articles (like this one), 2 videos, and 8 Research Brief articles.
Subscribing is also a great way to support the work we do here on Stronger By Science.
References
- Hall, K. D., & Kahan, S. (2018). Maintenance of Lost Weight and Long-Term Management of Obesity. The Medical clinics of North America, 102(1), 183–197.
- Helms, E. R., Prnjak, K., & Linardon, J. (2019). Towards a Sustainable Nutrition Paradigm in Physique Sport: A Narrative Review. Sports (Basel, Switzerland), 7(7), 172.
- Mountjoy, M., Sundgot-Borgen, J., Burke, L., Ackerman, K. E., Blauwet, C., Constantini, et al. (2018). International Olympic Committee (IOC) Consensus Statement on Relative Energy Deficiency in Sport (RED-S): 2018 Update. International Journal of Sport Nutrition and Exercise Metabolism, 28(4), 316–331.
- Loucks A. B. (2004). Energy balance and body composition in sports and exercise. Journal of Sports Sciences, 22(1), 1–14.
- Loucks A. B. (2003). Energy availability, not body fatness, regulates reproductive function in women. Exercise and sport sciences reviews, 31(3), 144–148.
- Burke, L. M., Lundy, B., Fahrenholtz, I. L., & Melin, A. K. (2018). Pitfalls of Conducting and Interpreting Estimates of Energy Availability in Free-Living Athletes. International Journal of Sport Nutrition and Exercise Metabolism, 28(4), 350–363.
- Rosenbaum, M., Hirsch, J., Gallagher, D. A., & Leibel, R. L. (2008). Long-term persistence of adaptive thermogenesis in subjects who have maintained a reduced body weight. The American Journal of Clinical Nutrition, 88(4), 906–912.
- Rosenbaum, M., & Leibel, R. L. (2010). Adaptive thermogenesis in humans. International Journal of Obesity (2005), 34 Suppl 1(0 1), S47–S55.
- Click the settings icon, then use the Katch-McArdle equation which takes body fat percentage into account to replicate.
- Kennedy G. C. (1953). The role of depot fat in the hypothalamic control of food intake in the rat. Proceedings of the Royal Society of London. Series B, Biological Sciences, 140(901), 578–596.
- Zhang, Y., Proenca, R., Maffei, M., Barone, M., Leopold, L., & Friedman, J. M. (1994). Positional cloning of the mouse obese gene and its human homologue. Nature, 372(6505), 425–432.
- Considine, R. V., Sinha, M. K., Heiman, M. L., Kriauciunas, A., Stephens, T. W., Nyce, et al. (1996). Serum immunoreactive-leptin concentrations in normal-weight and obese humans. The New England Journal of Medicine, 334(5), 292–295.
- Speakman, J. R., Levitsky, D. A., Allison, D. B., Bray, M. S., de Castro, J. M., Clegg, D. J., et al. (2011). Set points, settling points and some alternative models: theoretical options to understand how genes and environments combine to regulate body adiposity. Disease Models & Mechanisms, 4(6), 733–745.
- Ahima, R. S., & Flier, J. S. (2000). Leptin. Annual Review of Physiology, 62, 413–437.
- Kasacka, I., Piotrowska, Ż., Niezgoda, M., & Łebkowski, W. (2019). Differences in leptin biosynthesis in the stomach and in serum leptin level between men and women. Journal of Gastroenterology and Hepatology, 34(11), 1922–1928.
- Picó, C., Oliver, P., Sánchez, J., & Palou, A. (2003). Gastric leptin: a putative role in the short-term regulation of food intake. The British Journal of Nutrition, 90(4), 735–741.
- Izadi, V., Saraf-Bank, S., & Azadbakht, L. (2014). Dietary intakes and leptin concentrations. ARYA Atherosclerosis, 10(5), 266–272.
- Myers, M. G., Cowley, M. A., & Münzberg, H. (2008). Mechanisms of leptin action and leptin resistance. Annual Review of Physiology, 70, 537–556.
- Bassett, D. R., Schneider, P. L., & Huntington, G. E. (2004). Physical activity in an Old Order Amish community. Medicine and Science in Sports and Exercise, 36(1), 79–85.
- Weale, V.W., (1980). Eating patterns and food energy and nutrient intake of old order amish in Holmes county, Ohio (Doctoral dissertation, The Ohio State University).
- Júdice, P. B., Hetherington-Rauth, M., Magalhães, J. P., Correia, I. R., & Sardinha, L. B. (2022). Sedentary behaviours and their relationship with body composition of athletes. European Journal of Sport Science, 22(3), 474–480.
- Hall, K. D., Ayuketah, A., Brychta, R., Cai, H., Cassimatis, T., Chen, K. Y., et al. (2019). Ultra-Processed Diets Cause Excess Calorie Intake and Weight Gain: An Inpatient Randomized Controlled Trial of Ad Libitum Food Intake. Cell Metabolism, 30(1), 67–77.e3.
- I call this “simplified” because it holds up when conceptualizing what happens with normal weight individuals attempting to get lean and stay lean; however, it does not for individuals with obesity and/or metabolic disease. Large amounts of fat gain can change one’s intervention points, and leptin resistance, which is common in those with obesity, can impair the physiological responses which attempt to prevent further weight gain.
- Standard deviations only accurately represent normally distributed data (i.e., shaped like a bell curve). It’s quite possible, given how the dual intervention model works, that body fat wasn’t normally distributed. There may have been just a few outlier men who were close to 5%, and then a lot clustering around 9-12% to produce the mean.
- Sygo, J., Coates, A. M., Sesbreno, E., Mountjoy, M. L., & Burr, J. F. (2018). Prevalence of Indicators of Low Energy Availability in Elite Female Sprinters. International Journal of Sport Nutrition and Exercise Metabolism, 28(5), 490–496.
- Jeukendrup, A. and Gleeson, M., (2018). Sport Nutrition. Human Kinetics.
- Smith, S. J., Teo, S., Lopresti, A. L., Heritage, B., & Fairchild, T. J. (2022). Examining the effects of calorie restriction on testosterone concentrations in men: a systematic review and meta-analysis. Nutrition Reviews, 80(5), 1222–1236.
- Hector, A. J., McGlory, C., Damas, F., Mazara, N., Baker, S. K., & Phillips, S. M. (2018). Pronounced energy restriction with elevated protein intake results in no change in proteolysis and reductions in skeletal muscle protein synthesis that are mitigated by resistance exercise. FASEB Journal: Official Publication of the Federation of American Societies for Experimental Biology, 32(1), 265–275.
- Carbone, J. W., Pasiakos, S. M., Vislocky, L. M., Anderson, J. M., & Rodriguez, N. R. (2014). Effects of short-term energy deficit on muscle protein breakdown and intramuscular proteolysis in normal-weight young adults. Applied Physiology, Nutrition, and Metabolism, 39(8), 960–968.
- Elia, M., Stubbs, R. J., & Henry, C. J. (1999). Differences in fat, carbohydrate, and protein metabolism between lean and obese subjects undergoing total starvation. Obesity Research, 7(6), 597–604.
- Helms, E. R., Zinn, C., Rowlands, D. S., & Brown, S. R. (2014). A systematic review of dietary protein during caloric restriction in resistance trained lean athletes: a case for higher intakes. International Journal of Sport Nutrition and Exercise Metabolism, 24(2), 127–138.
- Longstrom, J. M., Colenso-Semple, L. M., Waddell, B. J., Mastrofini, G., Trexler, E. T., & Campbell, B. I. (2020). Physiological, Psychological and Performance-Related Changes Following Physique Competition: A Case-Series. Journal of Functional Morphology and Kinesiology, 5(2), 27.
- For those unfamiliar with the “τ” symbol, it represents Kendall’s tau, which is a nonparametric correlation coefficient, interpreted similarly to Pearson’s r. A value of zero reflects no correlation, and values closer to 1 or -1 represent stronger correlations, with the sign of the tau value (positive or negative) reflecting the direction of the association.