

I don’t have many hobbies, but there’s one I can reliably enjoy for the rest of my life. I don’t quite have the patience for birdwatching or the manual dexterity for woodworking, but I’ll always be here to enjoy the perpetual cycles in which nutrition researchers propose a novel, purportedly world-changing scoring system to help us sort the good foods or the good diets from the bad, and to subsequently enjoy the synchronized meltdowns within every silo of the online nutrition space. But that leads to a worthwhile question – do these food or diet scoring systems tell us anything useful?
A new study by Livingstone and colleagues (1) sought to explore relationships between “diet quality,” genetic risk factors, and body composition in a prospective study that observed 17,478 adults for a period of up to 10 years. Subjects were members of the UK Biobank cohort, which includes about 500,000 adults in the United Kingdom between the ages of 40-69 years old. As part of the UK Biobank study, participants submitted dietary intake information using the Oxford WebQ (a web-based dietary assessment tool), which was then used to quantify overall “diet quality” using three different diet quality indices: Recommended Food Score, Mediterranean Diet Score, and Healthy Diet Indicator. I won’t dive into the details of each individual scoring system (more on this later), but the general idea is that there are several indices that aim to tally up some basic dietary intake patterns in order to calculate an overall quality score for an individual’s diet. Bioelectrical impedance was used to gather trunk fat, total fat, and lean mass data for all 17,478 participants, while DXA was used to gather bone mineral content data for 11,887 participants. Genetic risk (for high adiposity) was quantified using blood samples. In line with previous work (2), the researchers were able to compute a composite, polygenic risk score for adiposity based on prior research identifying 97 single nucleotide polymorphisms that appear to be associated with body composition outcomes.
Broadly speaking, the results of this study are pretty straightforward. Independent of genetic risk, all three diet quality indices were inversely associated with trunk fat, total fat, and lean mass. For two of the three diet quality indices (Recommended Food Score and Healthy Diet Indicator), diet quality was positively associated with bone mineral content. There was a significant interaction effect between diet quality (Mediterranean Diet Score and Healthy Diet Indicator) and polygenic risk score, indicating that the impact of diet quality on body composition was larger among people with higher genetic risk scores. Higher diet quality was most strongly associated with lower indices of fat mass, trunk fat, and lean mass among people with higher genetic risk, whereas the impact of diet quality on bone mineral content wasn’t as dependent on genetic risk status. These findings are generally intuitive, but the lean mass findings might take some people by surprise. However, it’s important to remember that this study recruited people from the general population, where only a small percentage of individuals are likely to participate in regular resistance training for hypertrophy purposes. In the general population, lean mass is generally coupled to fat mass, so a lower-quality diet that promotes fat gain is also likely to be associated with greater lean mass accretion in the absence of resistance training.
Overall, this study seems to indicate that generic dietary scoring systems might have some predictive utility and valuable applications. However, if you keep an eye on the evidence-based nutrition chatter on social media, this might be a surprising observation. Over the last couple of years, two large attempts at launching new quality scoring systems have led to considerable criticism online. First, there was a study (3) that yielded countless headlines about how “eating a hot dog could take 36 minutes off your life.” This led to a tremendous amount of mockery targeting gross oversimplifications, such as the claim that eating a gram of fruit adds 0.1 minutes to your lifespan. Ultimately, this study reported nonsensically precise predictions that were presented in nonsensical units – while converting a food to minutes of life lost or gained might make it feel tangible to people who struggle to interpret more traditional risk metrics, I struggle to imagine there are many nutrition experts who take this metric both seriously and literally. People had fun with some of the claims and headlines resulting from this particular paper, but a more recent attempt at nutrition quality scoring led to absolute meltdowns.
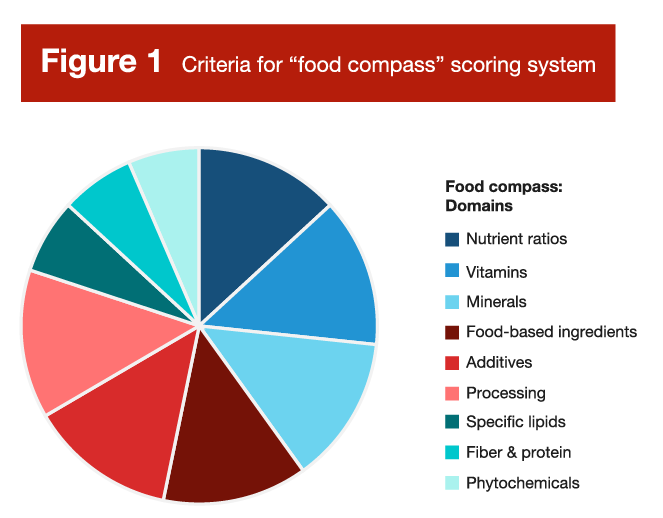
Researchers at Tufts University recently unveiled the “Food Compass” scoring system (4), which aims to assess the “healthfulness” of individual foods based on a set of criteria outlined in Figure 1. Overall, it looks like a sensible set of criteria; it seems plausible to assume that you could generally categorize the healthfulness or nutritional quality of foods based on their content of vitamins, minerals, protein, fiber, phytochemicals, and so on. However, in practice, the Food Compass led to some counterintuitive scores that prompted a great deal of controversy and criticism. A very cherry-picked selection of scores is presented in Figure 2. Normally, cherry-picking evidence is viewed as a negative thing, but there are some applications where cherry-picking has some degree of utility. When a new policy or law is being drafted, it’s both necessary and important to consider plausible scenarios in which the policy or law might fall short, break down, or lead to unintended consequences. An effective food scoring system should maintain face validity when foods are plotted head-to-head, and cherry-picking offers a shortcut for testing the robustness of such a system.
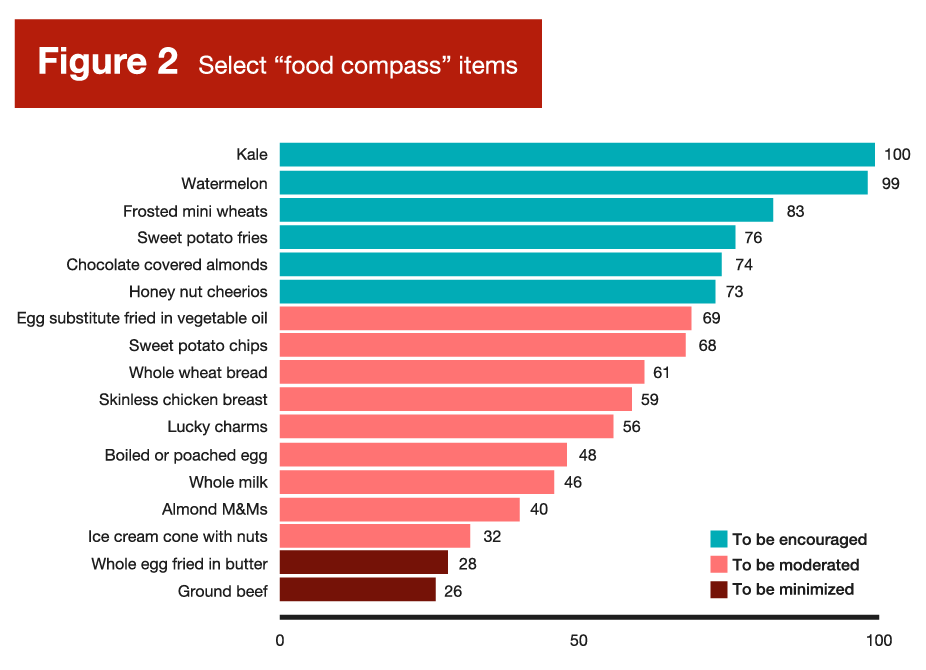
As you can probably infer from Figure 2, Food Compass scores were perceived by many carnivore, paleo, and carnivore-adjacent dieters as a direct ideological attack and an existential threat. As meat-forward diets that demonize processed foods gain more and more popularity, beef and eggs have been strategically reframed as superfoods among some niche (or even fringe) nutrition communities. Needless to say, there are a few comparisons in Figure 2 that led to absolute meltdowns. For example, egg substitute fried in vegetable oil had a higher score (69 points) than boiled or poached eggs (48 points), and a way higher score than real eggs fried in butter (28 points). In addition, literally everything in Figure 2 had a higher score than ground beef, including ice cream and candy.
I’m not one to carry water for the carnivore crowd, but some of their incredulity was justified in this particular case. Not because the carnivore diet is the optimal human diet and beef is a superfood, but because the creation of food scoring systems seems to be an exercise in futility, with research indicating that they generally rest on very shaky foundations (5). While the criteria in Figure 1 are relatively justifiable on the surface, weird stuff seems to happen when you start assigning composite scores to actual food items, and the results invariably yield counterintuitive and fairly indefensible rankings. When we separate a food from the context of the overall diet, and when we reduce a range of unique food characteristics to a single composite score, the result tends to range from useless to counterproductive. When selecting a specific food source, one might consider its palatability, texture, processing level, cost, convenience, energy density, role within the meal (as it pertains to complementing other food sources), and role within the diet (as it pertains to covering nutrient gaps). One might even branch out into broader considerations, such as ethical implications or environmental impact. With so many different characteristics being considered across a variety of domains with varying levels of individualized priority and emphasis, reducing a food to a singular quality score seems to be a fruitless endeavor, on par with using an algorithm to determine the best musical instrument or the best genre of music.
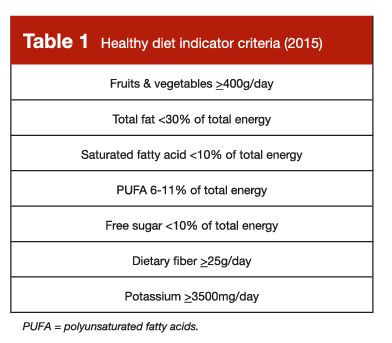
So, when it comes to individual food sources selected in isolation, we should resist the urge to paint with a broad brush that reduces the multifaceted characteristics of a food or beverage to a numerical score. However, the presently reviewed study suggests that we can, to some extent, paint with a relatively broad brush when considering overall dietary patterns. In this study, the World Health Organization’s Healthy Diet Indicator was reasonably predictive of body composition outcomes, and other research has validated its predictive utility in terms of morbidity, mortality, and micronutrient intake (6). The 2015 version (7) is presented in Table 1, and the 2020 version (6) is presented in Table 2. I present both in this Research Brief because there are slight differences between them, and they both present some independent, non-overlapping recommendations that are valuable.

This type of diet quality index can be applied in a useful way, but can just as easily be misapplied in a manner that is counterproductive. Ultimately, perspective is important when leaning on these types of diet indices. When we paint with a broad brush in nutrition, we are (by default) unable to walk away with precise, granular conclusions or recommendations. We shouldn’t view these types of indices as rigorous, detailed outlines of the perfect human diet, nor should we assume that any small deviation from these guidelines necessarily represents a deleterious diet pattern that requires immediate revision. The goal is to zoom out and acquire a big picture perspective; to identify some general targets that reinforce eating patterns which broadly seem to be associated with favorable health outcomes. In recent years, it seems like a lot of nutrition enthusiasts have become fixated on optimization rather than suitability, and looking for radical diet hacks rather than tried and true eating patterns that seem to reliably facilitate risk reductions that are boring, mundane, and modest, but clinically relevant.
The result of this mindset has been, in my opinion, severely damaging. That might sound like an overstatement, but this mindset dramatically shifts the types of questions being asked by nutrition enthusiasts and the general public alike, which leads to even more dramatic differences in the solutions that are proposed and popularized. In an ideal scenario, one might ask, “what types of feasible, sustainable dietary adjustments can I make to reduce my long-term risk of morbidity and mortality.” In this scenario, they could be pointed to Tables 1 and 2, make some small changes to their overall dietary pattern, and move forward with improved health, wellness, and confidence. In the less ideal (but more common scenario), one might ask, “how can I radically change my diet to optimize my health?” Radical questions often get radical answers, which leads to a whole host of baseless rants about how “they” lied to you about nutrition, the government guidelines are designed to keep us sick, vegetables are toxic, and it’s actually great to adopt a diet that sends your LDL cholesterol and Apo-B through the roof – if your doctor expresses concern about that, it’s because they’re behind the times or they’re in on the conspiracy.
In summary, nutrition science is imperfect. We don’t have all the answers yet, but we do have some, and we should actually utilize the things we’ve learned thus far. While scoring systems for specific foods are (in my opinion) a lost cause due to excessive decontextualization, there are validated sets of general dietary targets and guidelines which reinforce eating patterns that appear to be associated with positive long-term outcomes. From my perspective, the recommendations outlined in Tables 1 and 2 provide very useful guidance for someone who is trying to arrange a diet that minimizes their long-term morbidity and mortality risks. Adherence to these guidelines doesn’t necessarily yield a fully optimized diet, and deviation from one or more of these guidelines doesn’t necessarily yield a severely unfavorable diet. While these guidelines aren’t a detailed blueprint for the perfect human diet, we should (in my opinion) take them seriously and use them as a rough template for establishing a health-promoting dietary pattern, with plenty of room for individualization and customization from there.
We haven’t found the magical food quality or diet quality scoring system that steers us directly to a perfectly optimized diet, either at the individual or population level, but we absolutely have strong evidence linking some key dietary patterns to favorable health outcomes. If you’re receiving nutrition information from someone who encourages you to forget everything you thought you knew about nutrition and ignore the last 100 years of scientific evidence, run the other way. Plenty of nutrition influencers seem to advocate for the abandonment of the current consensus nutrition recommendations, based purely on the incomplete nature of our current understanding (which will always be incomplete, by default) or the overall cardiometabolic health status of affluent countries. However, there are enormous hurdles to clear before you can justify hitting the reset button and starting over; paradigm shifts are only defensible when a new, more justifiable paradigm accumulates adequate evidentiary support. The online nutrition space is currently littered with influencers who constantly insist that nutritional scientists know virtually nothing about nutrition, and the few recommendations they do provide are harmfully incorrect. Regardless of how confidently they’re delivered, these assertions are baseless, incorrect, and divert attention away from helpful, evidence-based dietary patterns that are consistently, empirically shown to be compatible with good health.
Note: This article was published in partnership with MASS Research Review. Full versions of Research Spotlight breakdowns are originally published in MASS Research Review. Subscribe to MASS to get a monthly publication with breakdowns of recent exercise and nutrition studies.
References
- Livingstone KM, Milte C, Bowe SJ, Duckham RL, Ward J, Keske MA, et al. Associations Between Three Diet Quality Indices, Genetic Risk And Body Composition: A Prospective Cohort Study. Clin Nutr. 2022 Sep 1;41(9):1942–9.
- Celis-Morales CA, Lyall DM, Petermann F, Anderson J, Ward J, Iliodromiti S, et al. Do Physical Activity, Commuting Mode, Cardiorespiratory Fitness And Sedentary Behaviours Modify The Genetic Predisposition To Higher BMI? Findings From A UK Biobank Study. Int J Obes. 2019 Aug;43(8):1526–38.
- Stylianou KS, Fulgoni VL, Jolliet O. Small Targeted Dietary Changes Can Yield Substantial Gains For Human Health And The Environment. Nat Food. 2021 Aug;2(8):616–27.
- Mozaffarian D, El-Abbadi NH, O’Hearn M, Erndt-Marino J, Masters WA, Jacques P, et al. Food Compass Is A Nutrient Profiling System Using Expanded Characteristics For Assessing Healthfulness Of Foods. Nat Food. 2021 Oct;2(10):809–18.
- Cooper SL, Pelly FE, Lowe JB. Construct And Criterion-Related Validation Of Nutrient Profiling Models: A Systematic Review Of The Literature. Appetite. 2016 May 1;100:26–40.
- Herforth AW, Wiesmann D, Martínez-Steele E, Andrade G, Monteiro CA. Introducing a Suite of Low-Burden Diet Quality Indicators That Reflect Healthy Diet Patterns at Population Level. Curr Dev Nutr. 2020 Dec;4(12):nzaa168.
- Kanauchi M, Kanauchi K. The World Health Organization’s Healthy Diet Indicator And Its Associated Factors: A Cross-Sectional Study In Central Kinki, Japan. Prev Med Rep. 2018 Sep 24;12:198–202.