

Energy density is a very straightforward metric: if you divide the energy content of a meal (in kilocalories) by the mass of the meal (in grams), you get the energy density. Foods with low energy density tend to have relatively higher content of water and fiber, on average, when compared to foods with higher energy density. Foods with low energy density fill our plates (and our stomachs) without delivering a huge caloric load; as a result, they tend to be associated with comparatively greater satiety, better hunger management, and lower energy intake. By extension, dieters pursuing weight loss goals are often advised to seek out foods with low energy density, and to reduce consumption of foods with higher energy density. Here are a few examples of the energy density of individual foods (in kcal/g units): lettuce (0.15), watermelon (0.30), grapes (0.69), skinless chicken breast (1.10), white bread (2.64), peanuts (6.00), and olive oil (8.85).
Imagine a hypothetical scenario in which you’re participating in a research study. In one study condition, you show up to the lab several hours after your most recent meal, you’re given a limitless amount of watermelon, and you’re encouraged to eat until you’re satisfied. In a second study condition, the procedures are identical, but you receive a limitless amount of cheesecake instead of watermelon. The most basic application of energy density is very simple: you’re probably going to consume more total calories during the cheesecake visit than the watermelon visit. But what is actually dictating your consumption? It doesn’t appear to be the mass or volume of food alone – you’d probably eat a larger mass and volume of watermelon than cheesecake, despite the fact that the cheesecake provides more calories. However, it also doesn’t appear to be calorie content alone – if that were the case, you’d simply eat the same amount of total energy at each visit, which would require tremendous amounts of watermelon intake to make the calories you consumed during the cheesecake visit.
The presently reviewed study by Flynn and colleagues (1) explored this concept via retrospective analysis of previously collected data. They first analyzed the data from a paper by Hall et al (2), which explored the effects of ultra-processed food intake on energy consumption and weight gain in tightly controlled conditions. Dr. Helms reviewed that study when it was first published, back in Volume 3 of MASS Research Review. They also analyzed data from the UK National Diet and Nutrition Survey, specifically looking at the 2000-2001 data from participants between the ages of 19-64 years old (3). This was an enormous survey intended to document the eating habits and nutritional status of the UK population, which contributed data from 1,724 individuals for the presently reviewed analysis. These two data sets allowed the researchers to separately look at tightly controlled, lab-based data and a huge sample of data from free-living individuals, and their analysis aimed to assess the relationship between the energy density of a meal and the number of total calories consumed at the meal.
Both data sets led to similar conclusions. When the overall energy density of a meal is low, food volume seems to be the predominant satiation signal dictating the amount of food consumed. The physical amount of space within a person’s stomach is inherently limited, and food intake is discontinued once a certain volume of food intake is achieved in order to avoid the discomfort associated with being overly full. The body senses that this point is reached based largely on the degree of gastric distention, without much influence at all from the total amount of energy consumed. However, there is an inflection point (probably between an energy density value of 1.25 and 2.25, give or take) beyond which food volume is no longer the predominant satiation signal. As the overall energy density of the meal gets higher, energy content becomes the major satiation signal dictating the amount of food consumed. In fact, meal size (in grams) tends to go down as energy density becomes very high. The researchers posit that the body integrates biological signals identifying high intakes of carbohydrate, fat, protein, and total energy, and eventually signals the discontinuation of the meal in order to avoid discomfort and “soporific” (drowsiness-inducing) effects related to excessive acute energy intake. The proposed two-component model of meal size is depicted in Figure 1.
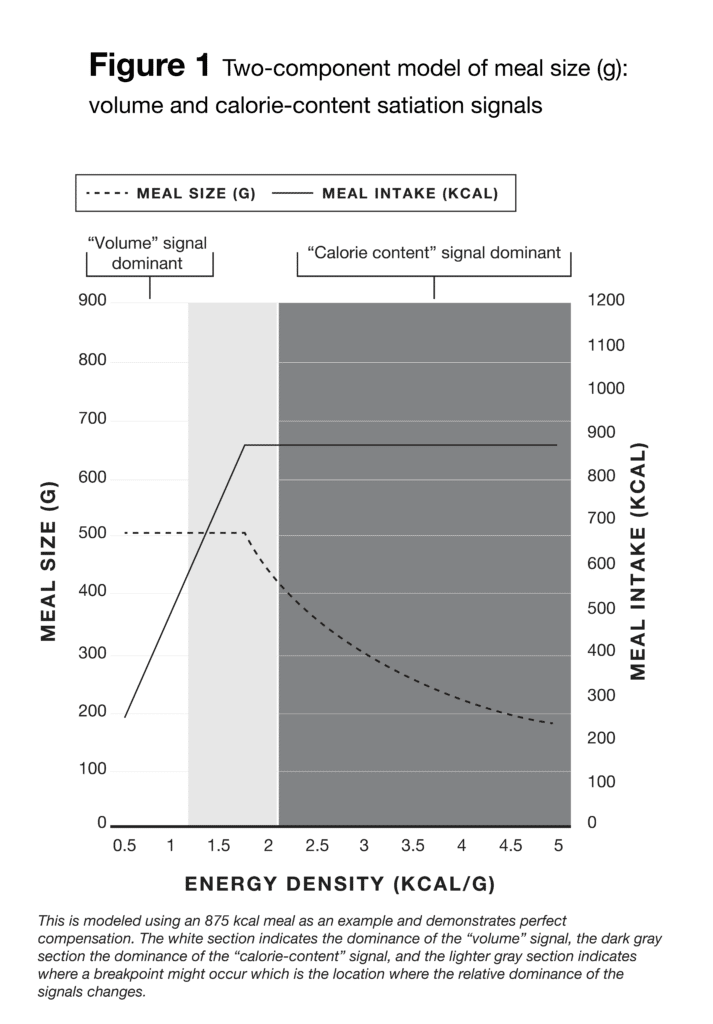
It’s important to recognize that this model is not, and does not claim to be, the singular model that explains the entirety of human meal size selection and energy intake. As the authors note, it makes no effort to directly account for macronutrient content, cravings, hedonic eating, or the many other complicating factors that can influence eating behaviors. Nonetheless, it fills an important gap in the literature. There are many different paradigms used to explore the effects of energy density on meal size and energy intake. For example, there are preload test meal studies (e.g., participants are fed a small snack shortly before a meal to see how it impacts eating behavior), short-term ad libitum studies (<10 days in duration), and longer-term ad libitum studies. Across these different study paradigms, the relationship between energy density, energy intake, and meal size seemed very inconsistent, as noted by the authors of the present study. However, when viewing these different bodies of literature through the prism of the two-component model depicted in Figure 1, the apparent discrepancies in previous studies were largely resolved. Collectively, the literature suggests that food volume is the key satiation signal when meal energy density is below ~1.75 kcal/g, while calorie content is the key satiation signal when meal energy density is above ~1.75 kcal/g.
Aside from filling a gap in the literature, this study also provides some guidance for practical application. When seeking out foods with low energy density, it seems like 1.75 kcal/g is a decent number to aim below. This isn’t a perfectly rigid threshold, of course, but it serves as a decent guide. In addition, if you’re trying to leverage low energy density meals as a strategy to manage hunger during a weight loss diet, it probably makes sense to focus more on the overall energy density of the meal rather than individual foods. For example, if swapping in one food with low energy density drops the overall energy density of a meal from 4.0 to 3.0, you’re still in a situation where food volume is not the predominant satiation signal, and the relative impact of this strategy will probably be modest in magnitude. In contrast, a similar food swap that brings the overall energy density of a meal from 2.5 to 1.5, or from 2.0 to 1.0, is likely to have a comparatively larger impact as the predominant satiation signal switches from calorie content to food volume.
This single strategy isn’t likely to single-handedly revolutionize the way you diet, but it can probably be combined with other satiety-related strategies to have a helpful cumulative impact. As stated previously, some practical strategies that may facilitate better hunger management during energy restriction involve adopting an acceptance-oriented approach to hunger, avoiding hyperpalatable meals, emphasizing unprocessed or minimally processed foods, incorporating some harder food textures, eating more mindfully, avoiding distractions while eating, and taking time to savor the aromas and flavors of our meal. Manipulating meal-level energy density is just one more tool to add to the toolbox.
Note: This article was published in partnership with MASS Research Review. Full versions of Research Spotlight breakdowns are originally published in MASS Research Review. Subscribe to MASS to get a monthly publication with breakdowns of recent exercise and nutrition studies.
References
- Flynn AN, Hall KD, Courville AB, Rogers PJ, Brunstrom JM. Time To Revisit The Passive Overconsumption Hypothesis? Humans Show Sensitivity To Calories In Energy-Rich Meals. Am J Clin Nutr. 2022 Aug 1;116(2):581–8.
- Hall KD, Ayuketah A, Brychta R, Cai H, Cassimatis T, Chen KY, et al. Ultra-Processed Diets Cause Excess Calorie Intake and Weight Gain: An Inpatient Randomized Controlled Trial of Ad Libitum Food Intake. Cell Metab. 2019 Jul 2;30(1):67-77.e3.
- Swan G. Findings From The Latest National Diet And Nutrition Survey. Proc Nutr Soc. 2004 Nov;63(4):505–12.