

Note: This article was the MASS Research Review cover story for December 2022 and is a review of a recent paper by Kadlec et al. If you want more content like this, subscribe to MASS.
Key Points
- The presently reviewed paper assessed the 20 most-cited meta-analyses in the field of strength and conditioning. After critically appraising these meta-analyses, the researchers found that 85% of them contained at least one statistical error.
- In exercise science and sports nutrition, it’s very common for meta-analyses to contain errors. The most common errors include ignoring outliers, conflating standard errors and standard deviations, ignoring within-study correlations, focusing on within-group results, and failing to account for within-study variance.
- The present article leans on previous MASS articles to show examples of these errors, and provides a thorough checklist to guide the process of critically reading meta-analyses in the future.
It’s time to talk about the big vaccine argument. I know these discussions get heated, but we can’t shy away from these types of debates just because they’re controversial or contentious. One side says the jab is a gamechanger, and that vaccine skeptics require an impractical standard of evidence. In fact, a reputable vaccine proponent accused a notable skeptic of building their argument on “cooked” statistics. The other side openly questions the quality of the data, and even accuses a key vaccine proponent of cherry-picking and being eager to “accept mythical reports” supporting his argument. By now, it’s probably pretty obvious which vaccine I’m talking about.
The year was 1904, and typhoid fever was top of mind for the British military. Intrepid bacteriologist Almroth Wright had introduced his first version of a typhoid vaccine in 1896, and it was rolled out slowly in subsequent years. By 1904, Karl Pearson was asked to conduct a statistical analysis of the available typhoid vaccine data. You might recognize that name from the Pearson correlation, which is mentioned in numerous MASS and Stronger By Science articles (but beware: if you wish to maintain a favorable, or even neutral view of esteemed statisticians of the early 1900s, don’t read any biographical material about them whatsoever). This task sounds simple enough, but there was one major issue: Wright absolutely despised statistics, saw little value in the statistical analysis of vaccine efficacy, and kept records accordingly – much of the available data were scattered, disorganized, and messy (2). Pearson attempted to aggregate the data from several distinct sources into a singular pooled analysis, in a project that is broadly viewed as the first iteration of contemporary meta-analysis (3).
On the positive side, this pioneering work introduced new methods and highlighted key considerations that set the future trajectory for the refinement of meta-analyses as we know them today. It was rudimentary and violated many “best practices” by current standards, but it was a critical first step toward modern meta-analysis. On the negative side, you could argue that Pearson’s conclusion was incorrect. He called for more evidence (which is typically a defensible stance to take), and was working with some pretty crappy data (and the computing power of a pencil and paper), but ultimately suggested that the use of this typhoid inoculation should not yet be a “routine method” for the military. This initiated a fierce and public war of words between Wright and Pearson, as I alluded to previously. Ultimately, the British army did administer a large number of typhoid vaccines, and this decision is estimated to have saved hundreds of thousands of lives by 1915 (2). After World War I, it was abundantly clear that the vaccine worked, and its administration became a routine practice.
Now, a very reasonable question: Why bother with the history lesson to kick off a Stronger By Science article?
First, it’s interesting, and interesting things are valuable for their own sake. Second, as systematic reviews and meta-analyses have become all the rage in the last 20-30 years, assuming the highest position in the hierarchy of evidence, it’s important to acknowledge the humble beginnings of the meta-analysis, and to remember that a meta-analysis is only as good as the quality of the underlying data and the suitability of the analytical approach. Nonetheless, over a century has passed, and technological leaps have unlocked previously unimaginable possibilities with regards to data reporting, management, and analysis. As such, modern meta-analyses are sure to be free from the errors that plagued the initial attempt in 1904… right?
That’s exactly what the presently reviewed paper (1) sought to explore. The researchers identified the 20 most frequently cited meta-analyses in the field of strength and conditioning, then checked them for statistical errors. Their findings were a bit sobering, as a staggering 85% of these papers contained errors. This article will not devolve into an overly technical, jargon-filled dissertation on statistics, though. Rather, we’re going to look at real-world examples of the most common statistical errors in meta-analyses, and focus on practical ways to easily identify these errors to avoid being misled by erroneous meta-analyses in the future.
Purpose and Hypotheses
Purpose
The purpose of the presently reviewed paper was “to review common statistical errors in meta-analyses and to document their frequency in highly cited meta-analyses from strength and conditioning research.”
Hypotheses
The researchers did not state specific hypotheses. If we consider the purpose of the paper, this makes a lot of sense. It’s very doubtful that these researchers woke up one day and randomly pondered whether or not meta-analyses in the strength and conditioning literature tend to contain statistical errors. Rather, I assume that these researchers saw a ton of statistical errors in meta-analyses over the last few years, and decided that it was time to bring some focused attention to this issue in an organized manner. We can infer that they expected to see a high prevalence of errors in this literature, because we can safely assume that they decided to initiate this project as a direct result of routinely observing so many errors.
Methods
The researchers began by reviewing a single published meta-analysis containing five separate errors that are commonly observed in the field of exercise science. Coincidentally, the paper they reviewed in this example happened to be the ninth-most-cited strength and conditioning meta-analysis. The presently reviewed paper was “initially conceived as a teaching article,” but it looks like the process of working through the errors in this meta-analysis piqued their curiosity. So, they did a systematic literature search aimed at gathering the 20 most-cited meta-analyses related to strength and conditioning topics. They had to omit one of them (it was already retracted because of statistical errors), so they included the 21st most-cited meta-analysis to take its place and round out the even list of 20. They worked through each meta-analysis to quantify the prevalence of the five common statistical errors at the heart of their initial inquiry.
Findings
Looking at the 20 most-cited meta-analyses in the field of strength and conditioning, 85% contained at least one statistical error. The five common errors they screened for, and the prevalence of each individual error (% of meta-analyses committing the error), are as follows:
- Ignoring outliers: 25%
- Miscalculated effect sizes that arise from using standard errors instead of standard deviations: 45%
- Ignoring within-study correlation (failing to account for correlated observations): 45%
- Focusing on within-group rather than between-group results: 45%
- Failing to account for within-study variance (failing to weight studies): 40%
If you’re a bit uncertain about the precise meaning of some of these errors, fear not – that’s what the rest of this article is for. Rather than wrestling with jargon-filled textbook definitions, we’ll take a look at real-world examples of these errors, with a focus on previous MASS Research Review articles.
Criticisms and Statistical Musings
This is certainly not a criticism, but it’s an important detail to keep in mind: these researchers stacked the deck in a way that might actually understate the prevalence of the problem at hand. By focusing on the top 20 most-cited meta-analyses in the field, they theoretically gave themselves a bit of an uphill battle in terms of error identification. Citations are a type of currency among researchers; whereas social media influencers might view content engagement statistics as markers of success, researchers lean on citations as an analogous, indirect (and imperfect) form of evidence that their research is making an impact and being favorably appraised by their peers. As meta-analyses have become more and more popular in our field, there has been a huge influx of low-quality meta-analyses that are essentially flying under the radar – they aren’t making a big enough splash to garner widespread citations or generate substantial chatter, so the papers aren’t getting enough attention for errors to be detected and flagged.
I know what you’re thinking – Eric, these are peer-reviewed papers, so the reviewers are likely to catch potential errors in these low-profile papers. Well, here’s the worst-kept secret in exercise science: very few people truly know how to conduct a meta-analysis start-to-finish, which is the level of familiarity and expertise needed to provide a sufficiently thorough review of a meta-analysis. I know a great many researchers; in fact, for about 10 years, academics were the only people I spent a meaningful amount of time with. I only know a handful who would be totally comfortable firing up their computer and running a meta-analysis that is fully aligned with current statistical best practices. So, who is doing and reviewing all these meta-analyses in exercise science? To answer that question, I’ll refer you to the 85% error rate, and once again remind you that this error prevalence pertains to, theoretically, the cream of the crop in exercise science meta-analyses. The error rate is astronomical, and it would be illogical to expect otherwise.
Interpretation
As a writer for Stronger By Science and MASS, my primary goal is to ensure that readers are fully up-to-speed with the most relevant exercise and nutrition literature. However, my more ambitious goal is to help readers stay ahead of the curve (when possible), which is a very dangerous game. The fitness industry is full of people who say their anecdote-driven methods allow them to stay “ahead of the science,” while science will eventually contradict at least 80-90% of their “innovations” in due time. In other words, most people who try to stay ahead of the curve are fooling themselves and have an unacceptably low success rate with their speculative practices. Once your success rate falls below a certain threshold, it becomes hard to argue that you’re even leaning on evidence-based principles anymore, so attempts to outpace the science should be approached with a high level of discernment and caution. In this example (common errors in meta-analyses), I am pleased to say that MASS readers were truly ahead of this particular curve. All the way back in Volume 4, I wrote the following:
“We can’t uncritically accept the results of meta-analyses at face value. Of course, I would agree in theory that meta-analyses belong at the top of the hierarchy of evidence. However, that placement is based on a number of very, very critical assumptions: the search identified all of the relevant studies, the authors weeded out the studies that shouldn’t be included, the individual studies were carried out and reported effectively, an appropriate selection of outcomes was extracted from the studies, effect sizes were calculated effectively, and the statistical approach to the meta-analysis was appropriate. If one or more of these assumptions are violated, that place atop the hierarchy of evidence doesn’t mean much anymore, and it’s quite common to see one or more of these assumptions violated.”
With this in mind, let’s look back at some previous MASS articles to explore the most common errors flagged in the presently reviewed paper.
Ignoring outliers
Back in Volume 4 of MASS, I reviewed a meta-analysis about arginine supplementation (4). In doing so, I noticed some outliers that the researchers didn’t really account for. To visually examine the impact of these outliers, I provided two versions of the funnel plot: one with outliers included, and one with outliers removed. In ideal scenarios, a funnel plot should look like – you guessed it – a funnel. Studies with more precise effect size estimates (which tend to be larger studies) should cluster very closely around the overall, pooled effect size from the meta-analysis. Studies with less precise effect size estimates (which tend to be smaller studies) should be expected to display greater variation. This causes them to “fan out” in a symmetrical pattern, which gives the plot its “funnel” shape. Without getting too bogged down in the details (more on this later), a funnel plot gives us a visual representation of some key statistical characteristics of the literature being summarized in a meta-analysis. So, let’s see how outliers impacted the arginine funnel plot (Figure 1):
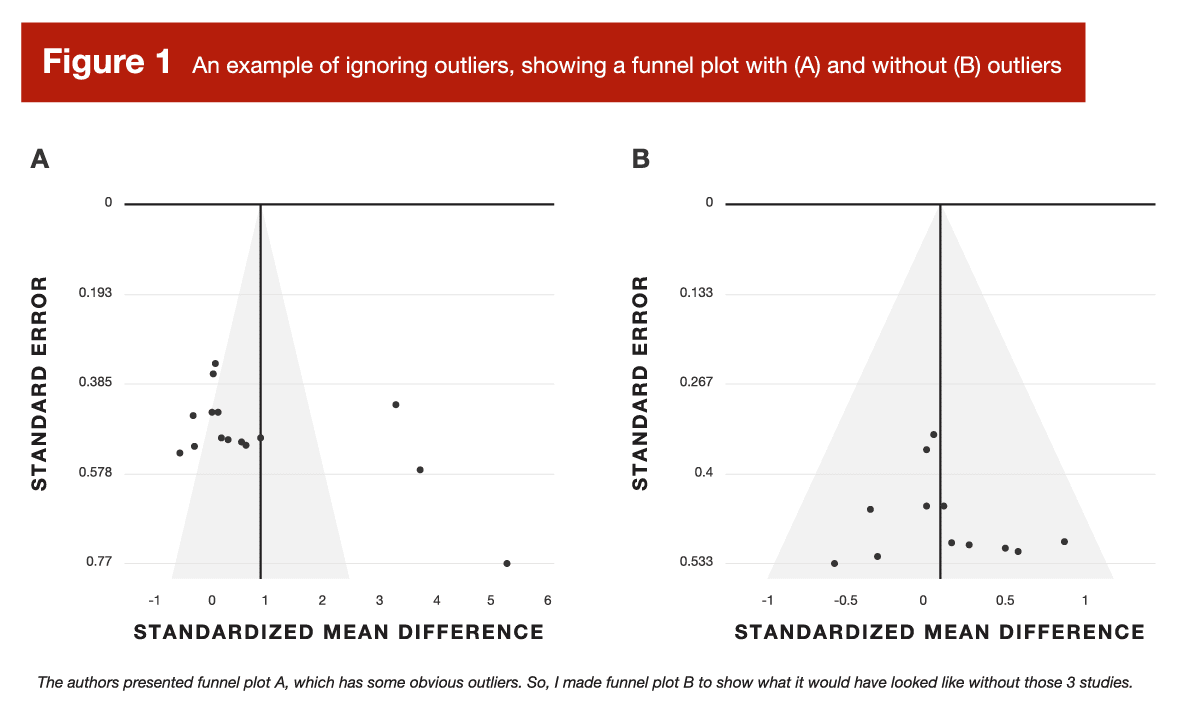
The original funnel plot (A) was, frankly, a disaster. After removing the outliers (B), it looked very suitable. When you get a funnel plot that looks like version A, it’s next to impossible to take the pooled effect seriously at face value. But that leads to a valid question – how did funnel plot A come to be so disastrous? That leads us to error #2.
Miscalculated effect sizes that arise from using standard errors instead of standard deviations
We saw this exact error in the arginine meta-analysis I reviewed back in Volume 4 of MASS. The forest plot from this study is presented in Figure 2.
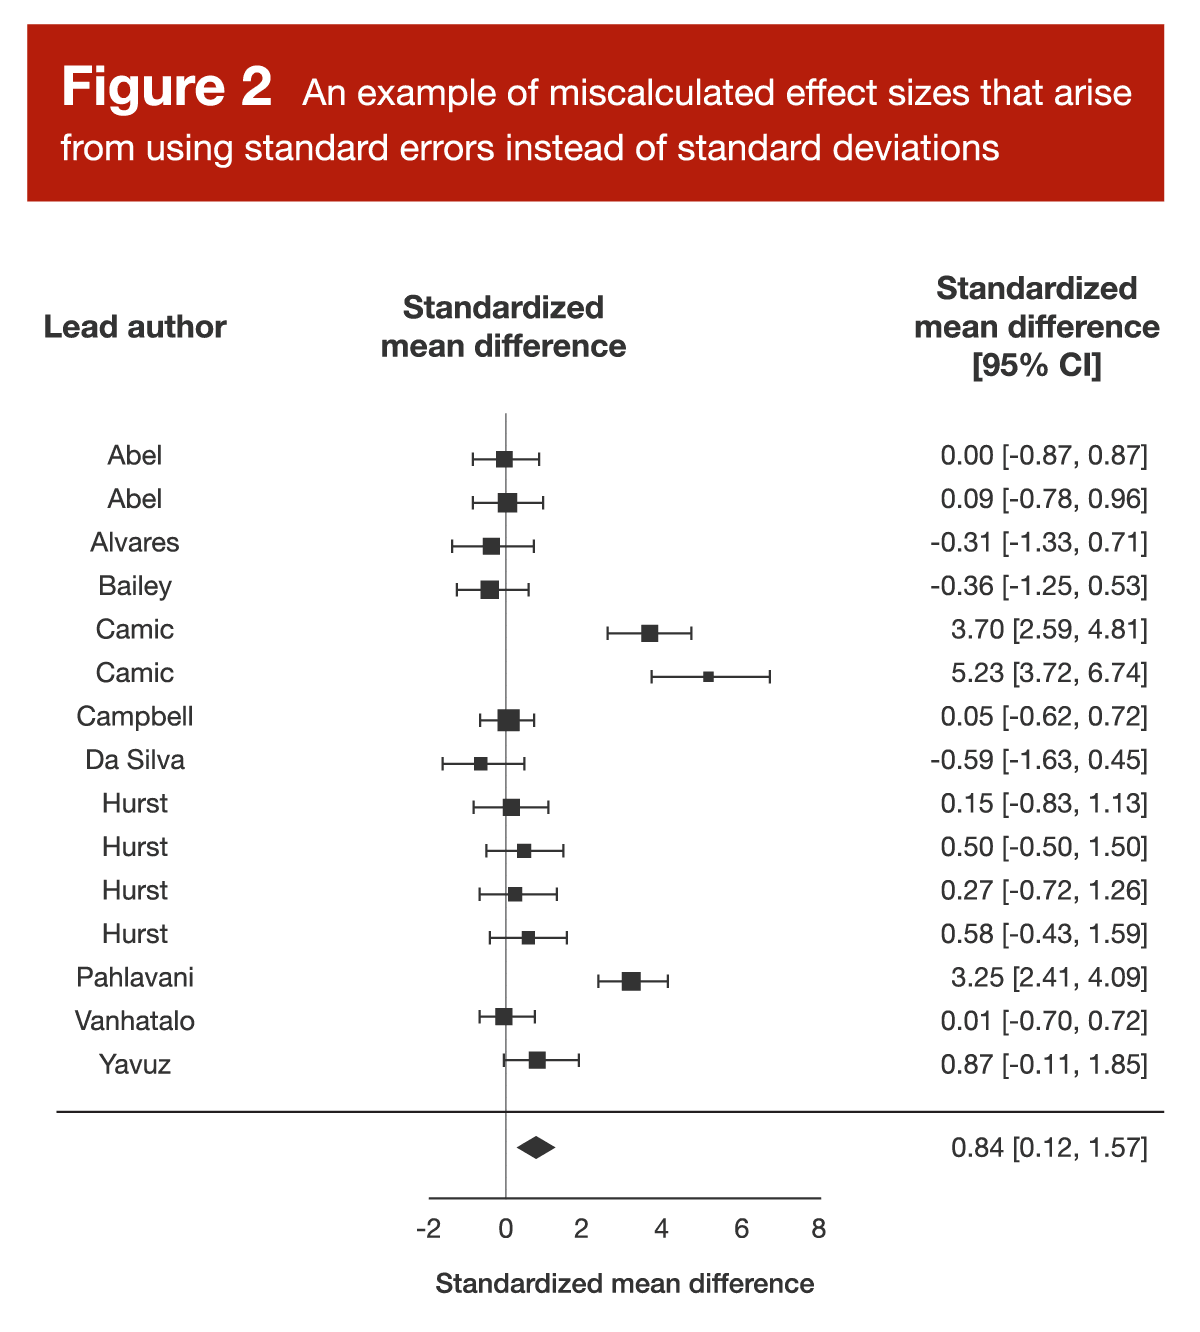
When you examine Figure 2, three data points should catch your attention. There are three separate data points representing effect sizes well above 3.0, which would be large enough for the authors of the presently reviewed paper to call them “outliers” without even looking at the rest of the data. Upon closer inspection, it was clear that the researchers conducting the arginine meta-analysis had misinterpreted some standard error values, believing them to be standard deviations. This is a pretty huge deal, because the effect sizes reported in this meta-analysis were calculated by dividing the difference in means (arginine group versus placebo group) by the pooled standard deviation. We can convert standard error to standard deviation by multiplying standard error by the square root of the sample size; based on this equation, it’s clear that standard error values are much smaller than standard deviation values, and this difference gets larger as the sample size increases.
To illustrate, imagine a study comparing the effects of two training interventions on gains in squat 1RM. At baseline, the subjects had an average squat 1RM of 100 ± 20kg. At the end of the study, we observe that one training protocol led to a 30kg increase in squat strength, while the other protocol led to a 20kg increase in squat strength, resulting in a between-group difference of 10kg. To correctly calculate the effect size, you divide that 10kg difference by the pre-training standard deviation for squat 1RM strength (20kg), resulting in an effect size of 0.5. However, if there were 16 subjects per group, you’d divide the pre-training standard deviation by the square root of 16 (four) to calculate the standard error: 20/4 = 5kg. So, if you erroneously calculated an effect size by dividing the difference in strength gains (10kg) by the standard error (5kg) instead of the standard deviation (20kg), you’d calculate an effect size of 2.0, thus inflating the magnitude of the effect four-fold. If there were 100 subjects per group, the standard error would be 2kg, and the erroneously calculated effect size would be 5.0.
So, if you check out a forest plot and you see an effect size (or a few) that looks unusually huge, it’s always a good idea to make sure the researchers didn’t mistake a standard error for a standard deviation. In fact, the authors of the presently reviewed paper found that about 60% of the effect sizes >3.0 that they observed were a direct result of this error.
Ignoring within-study correlation (failing to account for correlated observations)
Back in Volume 4 of MASS, I reviewed a meta-analysis about the effects of carnitine supplementation on recovery from exercise (5). Within that article, I included a forest plot (Figure 3).
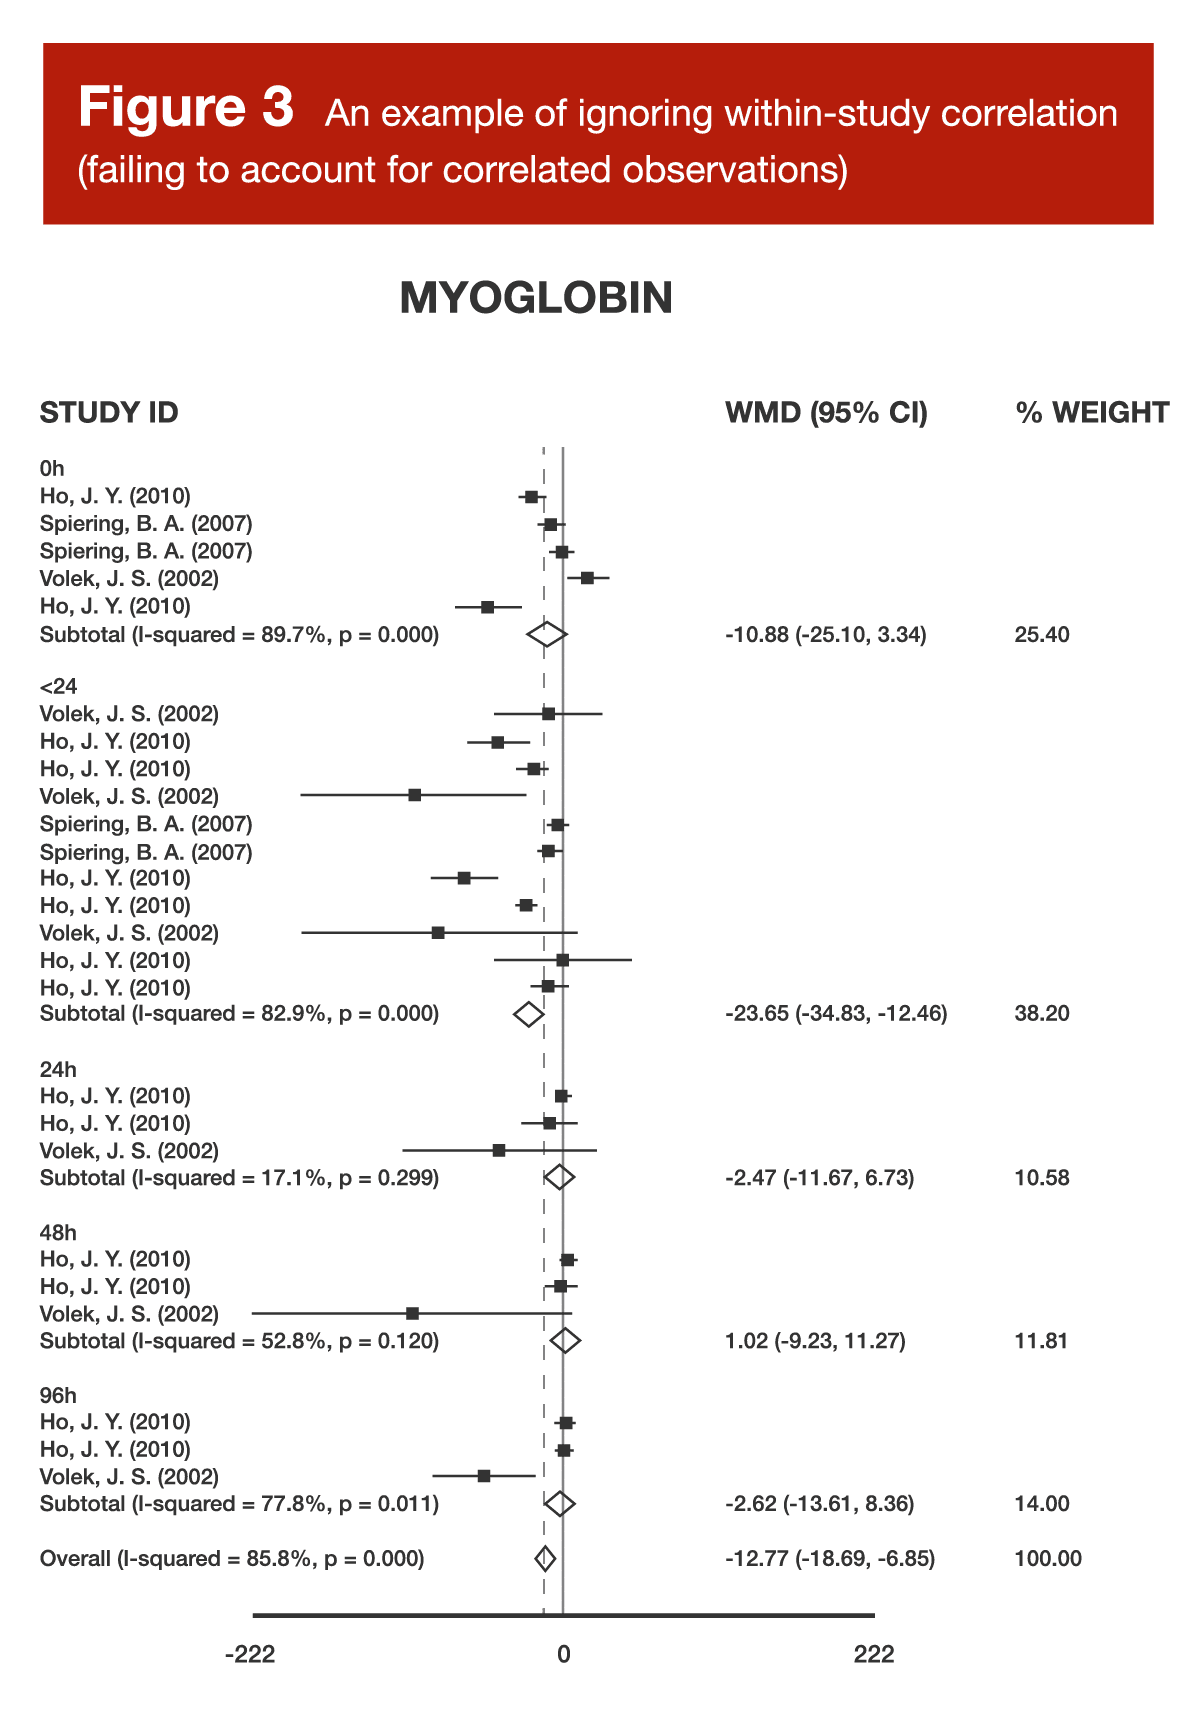
When examining Figure 3, you might notice that there are multiple studies, as identified by the combination of author and year in the left-hand column, contributing several different effect sizes to the same analysis. When a meta-analysis treats (from a mathematical perspective) a single study as if it were two separate studies, this is known as “double counting,” and treating a single study as if it were three separate studies is known as “triple counting.” The more times you count a single study in a meta-analysis (without appropriate mathematical adjustments), the worse it gets. Imagine you’re in a group of five total people voting on an important decision, but one person in the group gets three votes. If the decision ends up being 5 “yes” votes to 2 “no” votes, the triple-counted voter has made the decision appear far more lopsided than it truly is. If the triple-counted voter decided to vote “no” while everyone else voted “yes,” the result would be 4-3, but this would make the decision seem a lot closer than it really was. When researchers fail to account for studies that are using “extra votes” in a meta-analysis, the studies in question have an inappropriately exaggerated impact on the pooled effect estimate, and may lead researchers toward an inappropriately inflated confidence level in the pooled effect estimate. For more details about double counting, along with an in-depth example, be sure to check out Greg’s article from Volume 5.
Focusing on within-group rather than between-group results
Back in Volume 4 of MASS, I reviewed a meta-analysis about the effects of vitamin D supplementation on strength outcomes (6). In my article, I noted the following:
“Typically, for this type of literature, you’d calculate the effect size based on the change in the placebo group (from pre-testing to post-testing), the change in the vitamin D group, and then some form of standard deviation for each group– either the standard deviation of the pre-test or post-test value, or the standard deviation of the change from pre- to post-testing. For the current meta-analysis, they took a very different approach. Effect sizes were calculated using only the pre-test value in the vitamin D group, the post-test value in the vitamin D group, and the standard deviations at each time point. This is quite atypical, and totally ignores a key, defining feature of these studies, which is that they included a placebo group. The strength of the placebo-controlled design is that we can directly evaluate the effect of the treatment above and beyond the effect of the placebo; to ignore this in the effect size calculation is to adopt a less informative interpretation of each study’s individual results.”
From a theoretical perspective, this error detracts from key concepts that make randomized, placebo-controlled trials so robust and informative. From a practical perspective, this error typically leads to inflated effect sizes. In a placebo-controlled trial, we often (but not always) expect that the placebo group will make some degree of positive progress, and our research question focuses on the added benefit of the experimental treatment, above and beyond the positive progress experienced in the placebo group. Failing to frame the treatment group’s results relative to the results observed in the placebo group often leads to a situation where the meta-analysis is not purely quantifying the independent effect of the experimental treatment, but is actually quantifying the additive effects of the experimental treatment plus the gains that would have been observed in a placebo group.
Failing to account for within-study variance (failing to weight studies)
All the way back in Volume 3 of MASS, Dr. Zourdos reviewed a systematic review about the effects of sodium bicarbonate supplementation on intermittent exercise performance (7). When interpreting this body of literature, the researchers used a semi-quantitative analytical technique known as “vote counting.” Basically, they tallied up the studies that found a statistically significant effect, tallied up the studies that didn’t find a statistically significant effect, and compared the numbers. We shouldn’t judge this decision too harshly, as the researchers did not frame their paper as a meta-analysis, used this technique for descriptive purposes rather than framing it as a nuanced quantitative analysis, and interpreted their results with an appropriate level of caution. Nonetheless, it’s an example of drawing “unweighted” inferences from a body of literature. With this approach, every study gets exactly 1.0 “votes,” regardless of how large the study was, or how precise its effect size estimate was.
If you live in the United States, we can lean on the US Congress as a practical example of weighted versus unweighted approaches. The Senate is unweighted; every single state gets two representatives. In contrast, the House of Representatives is weighted; larger states get more representatives (based on their state population), and therefore have more relative influence within the House of Representatives. With a meta-analysis, we want to use weighted analyses whenever possible, because it’s statistically appropriate for some studies to have far less influence on the pooled results than others. Most meta-analyses in our field use “inverse variance weighting,” which functionally means that studies are weighted by sample size. Sample size and the variability of the observed results both influence variance, but, in general, larger studies have lower variance, and are thus more heavily weighted in meta-analyses. If one study has five subjects per group, and another study has 100 subjects per group, you’d probably want to give more weight to the study with 100 subjects per group. The presently reviewed study found that 40% of the most-cited meta-analyses didn’t do this type of weighting, and thus implicitly assume that a study with 100 subjects per group and a study with 5 subjects per group should receive equal weight.
A major caveat
The purpose of this article is to be helpful and pragmatic rather than nitpicking for the sake of pedantry. With this in mind, I want to acknowledge that there are varying degrees of meta-analysis sins, and that the severity of the sin often depends on the surrounding contextual factors and interpretation. For example, mixing up standard errors and standard deviations is a major, unforgivable sin – it totally messes up your analysis, and it’s wrong in all contexts. Double-counting or triple-counting samples (failing to account for correlated observations) typically isn’t quite as egregious, but there’s still no context where it would actually be justifiable, and there are way too many viable ways to deal with this issue in user-friendly softwares for researchers to keep committing this error. However, there are situations where certain “statistical errors” are forgivable, or even acceptable, as long as they’re interpreted appropriately.
For example, I previously mentioned the concept of “vote counting” when discussing a systematic review on sodium bicarbonate. If the researchers interpreted this as a robust, nuanced, quantitative analysis, that’d be incorrect and inappropriate. However, if you’re tallying up votes just to describe the general landscape of the literature, then following up with a very nuanced qualitative analysis, there’s really nothing wrong with that. For another example, I think some people will be surprised to note that one of the most frequently cited protein analyses in the evidence-based fitness world (8) technically commits two of the five errors reviewed in this article – and I’m totally fine with it.
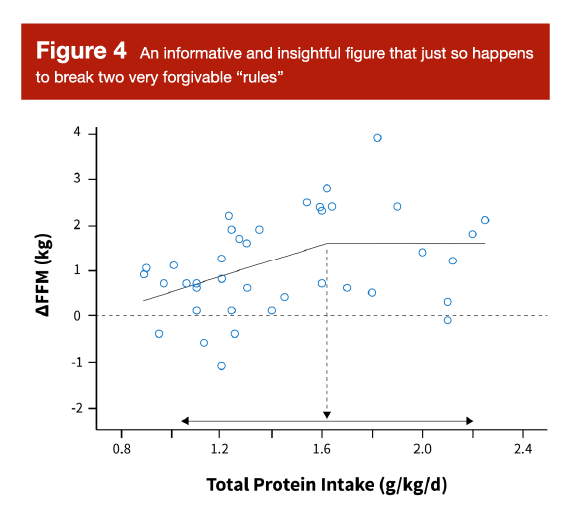
You’ve probably seen Figure 5 before. It’s the figure (and analysis) mostly commonly used to support the daily protein recommendation of 1.6-2.2 g/kd/day for lifters. I think it’s a very helpful and informative figure, and I think it provides a nice, surface-level overview of the literature linking daily protein intakes to increases in fat-free mass. However, unless I’ve misunderstood the description of this analysis in the original paper, it appears to focus on within-group rather than between-group results, and it doesn’t appear to account for within-study variance (that is, it doesn’t weight studies). So, does this figure perfectly conform with the most rigorous statistical principles in the realm of meta-regression? No. Does it provide an informative and insightful look at the data? Absolutely.
I spend a great deal of time and effort exploring the interpretation of this figure in my other full-length article this month, so I don’t want to belabor the point by reprinting that information here. However, the concise summary is that this figure is very informative, but needs to be interpreted in a nuanced and contextualized manner. It would be incorrect to say “we know that the optimal range for daily protein intake begins at precisely 1.6g/kg/day, due to a robust statistical analysis that is unimpeachable and beyond reproach.” Even if we ignore the lack of weighting and the focus on within-group effects, the 95% confidence interval spans from around 1.0-2.2 g/kg/day anyway.
To more appropriately interpret this figure, we need to begin by acknowledging an unstated assumption. Before we even look at it, we are assuming the following: “if protein has such a big impact on hypertrophy, we should be able to see glimpses of that relationship, even if we neglect to weight studies and control for study characteristics that differ among individual studies.” In other words, this figure isn’t actually filtering out the “signal” from the “noise,” but the signal should be detectable nonetheless. Then, upon scanning the figure, we can broadly conclude that higher protein intakes (greater than around 1.2 g/kg/day) seem to be better than lower intakes (less than around 1.2 g/kg/day), but returns start to diminish at a certain point. Our “best estimate” of that point would be 1.6 g/kg/day based on this relatively surface-level analysis, but this estimate is extremely imprecise, with a 95% confidence interval spanning all the way from 1.0 to 2.2 g/kg/day. Visually, it looks like intakes above 1.2 g/kg/day are pretty solid, but lifters who would rather overshoot than undershoot their protein needs might prefer to aim for a daily intake target above 1.4 or even 1.6 g/kg/day. I walk through this example to illustrate an important point: it’s okay to visualize, examine, and even analyze data using methods that are a bit unconventional or slightly incongruent with the most rigorous statistical standards possible. However, the resulting interpretation should transparently reflect the nuance and rigor of the analytical approach. Surface-level analyses can be informative and useful without being precise, but we have to interpret the conclusions with an appropriate level of caution and imprecision.
The meta-analysis checklist
Now that we’ve gone through the most common errors in meta-analyses, I’d like to take the practical application one step further by going through a list of items to check as you’re reading through a meta-analysis on your own. For this list, I am assuming that the researchers thoughtfully selected a defensible research question and conducted their literature search proficiently, which frees us up to focus on the most pertinent issues that impact the analysis itself. This list certainly isn’t exhaustive or fully comprehensive, but it’s a practical guide that hits the most practically important highlights.
1. Are the data reported at the group-level or participant-level?
In exercise science meta-analyses, data are almost always reported and analyzed at the group level. For example, the overall effect size of a study will be determined by comparing the results in the supplement group to the results in the placebo group, and the whole study contributes one single data point to a meta-analysis. However, there are sometimes opportunities to conduct participant-level meta-analyses, where each individual data point from raw studies is included in a massive meta-analysis that retains individual, person-level data points instead of collapsing everything into a group-level summary. So, if you’re pooling the results from 10 studies with 100 participants each, a “standard” (group-level) meta-analysis would have 10 data points, but a participant-level meta-analysis would have 1,000 data points. When you come across a participant-level meta-analysis, you’re in luck! This is about as good as it gets in the world of meta-analyses (9), but all standard caveats apply – crappy data or crappy analytical techniques still yield a crappy meta-analysis, even when participant-level data are involved. If you’re reading a participant-level meta-analysis, check the methods to make sure that the researchers dealt with correlated data (within-study correlations) appropriately. In my opinion, linear mixed models (which may be described as multilevel models, hierarchical models, or general linear models with random effects) are the best way to go with a participant-level meta-analysis.
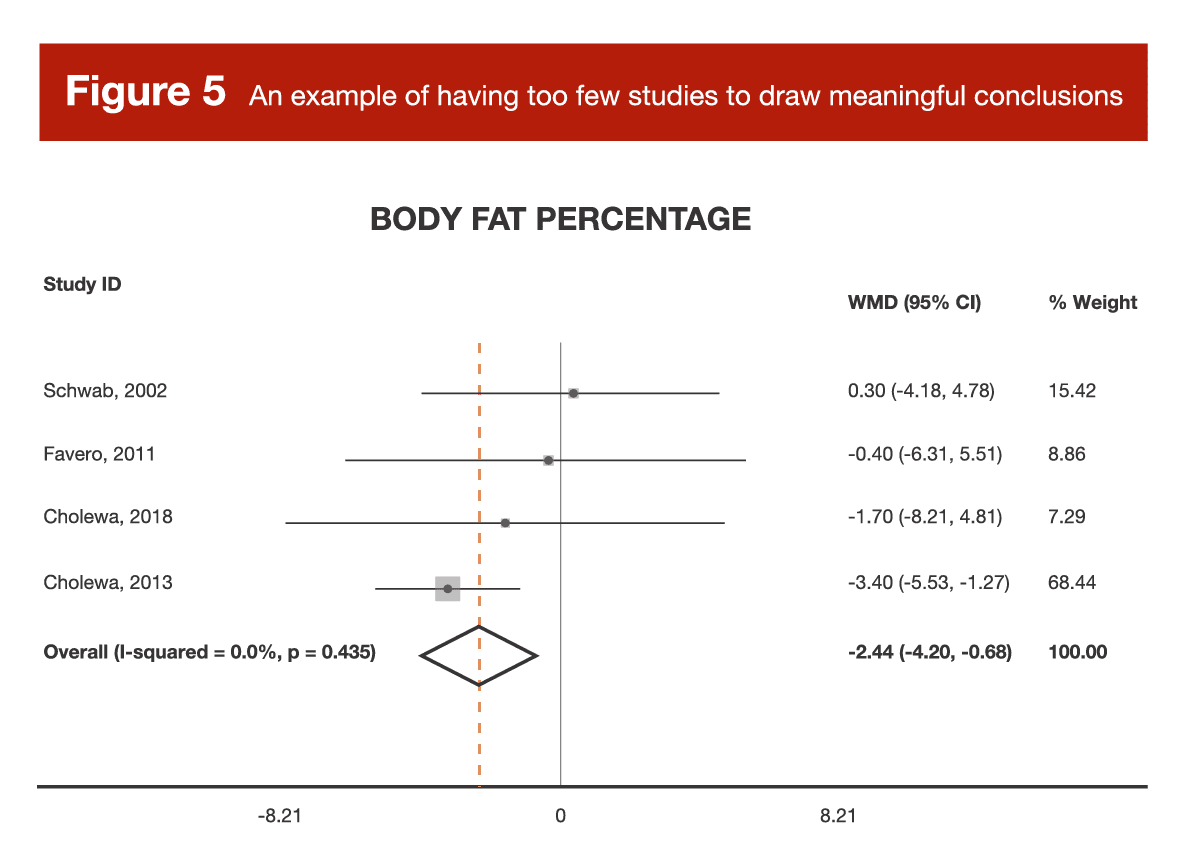
2. Are there enough studies or participants to draw strong conclusions?
The theoretical advantage of a meta-analysis comes down to strength in numbers. As we gather more and more studies on a particular topic, we have opportunities to become more confident in the typical effect of the intervention, and to explore key factors that might modify the effectiveness of the intervention. But where exactly is the inflection point – how many studies do you need before a meta-analysis actually becomes meaningfully more informative than looking at the one or two randomized controlled trials that are most pertinent to your intended application?
It’s truly hard to settle on a generalizable heuristic or rule of thumb, but let’s look at an example. Back in Volume 3, I reviewed a meta-analysis of studies investigating the effects of betaine supplementation on fat loss (10). There were multiple outcomes analyzed (body weight, BMI, waist circumference, fat mass, and body-fat percentage), but for each individual outcome, there were only 2-5 effect sizes to actually pool and analyze. These studies differed across a range of important study characteristics, but there weren’t nearly enough studies to actually sort through the impact of those study characteristics in a meaningful way. Furthermore, for most outcomes, a pair of studies by the same author carried around 70-75% of the weight for the analysis. In other words, the results of the meta-analysis were basically the results of the two studies by Cholewa et al. In some cases, a meta-analysis with only a few small, heterogeneous studies tells us no more, and potentially even less, than a large, well-controlled randomized trial.
When it comes to interpreting meta-analysis, I think the size of a meta-analysis falls on a spectrum that greatly impacts interpretation. A meta-analysis with a few heterogeneous studies can lead to some unreliable conclusions, and should be approached very cautiously. A meta-analysis with a few homogeneous studies can actually give us a more reliable effect estimate than any of the individual papers, but we can’t generalize the conclusion to other contexts (the meta-analysis is meaningful because the studies are so similar, but the conclusion is necessarily tied to the characteristics that made the studies so similar, such as population, duration, intervention details, outcome of interest, and so on). As a meta-analysis gets even bigger (let’s say more than a handful of studies, but less than two dozen), we find ourselves in a middle ground. These analyses can help us generate some very insightful hypotheses for future research, but we shouldn’t draw any overly confident conclusions. For example, I did a meta-analysis on citrulline supplementation (11), which was reviewed in MASS before I became part of the team. In that paper, I emphasized that, due to the small number of studies included (13 independent samples from 12 total studies), the results should be viewed as fairly preliminary, and should be used to generate hypotheses more so than conclusions. Eventually, meta-analyses get large enough to start really shining. Once you’ve got a few dozen studies or more, you can start to use a wide range of statistical tools to sort out nuanced interpretations of the literature. For example, you eventually get enough data to meaningfully analyze whether a particular dosage is more effective than another, whether women experience larger effects than men, whether the intervention works better for people who are exercising than those who are not, and so on.
Now, what should researchers do when they systematically review the literature, apply their inclusion and exclusion criteria, but find that there isn’t enough data to provide a meaningful and informative quantitative analysis of pooled data?
That’s easy. They should move forward with the systematic review, and forgo the calculation of a pooled, quantitative analysis. This would involve going through the individual studies to provide a nuanced interpretation of the relevant research, and trying to provide a thorough, qualitative analysis of the literature as a whole. A common misconception is that meta-analyses are a “step up” from systematic reviews – this is categorically incorrect. Systematic reviews exist at the very top of the hierarchy of evidence, and meta-analyses are simply a particular type of systematic review that happens to include a quantitative analysis of pooled data. Along these lines, you might notice that many meta-analysis titles include the phrase “a systematic review and meta-analysis,” or “a systematic review with meta-analysis.” A systematic review may or may not include a meta-analysis component, and the inclusion or omission of a meta-analysis does not make a systematic review inherently better or worse.
The decision to include a quantitative analysis is not dictated by ambition or preference, but by the characteristics of the literature that you’re systematically reviewing. If adding a quantitative meta-analysis would be informative and the data have the necessary characteristics to enable a pooled analysis, then researchers should go for it. If the systematic review returns a set of data that are unsuitable for a pooled analysis, then researchers should keep the systematic review qualitative instead of forcing a flawed analysis. In other words, systematic reviews are the top level of the hierarchy of evidence, and researchers should make their systematic review only as quantitative as the characteristics of the data indicate – no more, and no less. A systematic review with no meta-analysis provides an unequivocally better summary of the evidence than an ill-advised meta-analysis that yields an unreliable effect estimate.
3. Are these studies similar enough to even think about combining their data?
Let’s keep rolling with the previous example about betaine and fat loss. This analysis included a very small number of studies, and the included studies varied considerably. Some studies sampled untrained subjects, others sampled trained subjects; some studies sampled lean and active participants, while others sampled relatively inactive people with obesity; some studies included resistance training, others did not; some studies were less than 2 weeks long, others were in the 6-12 week range. So, when you pool these findings to look at an “average” result, what exactly are you looking at? It’s kind of like taking a sweet meal, a savory meal, and a spicy meal, throwing them into a blender, and trying to judge the chef’s skill level based solely on the disgusting smoothie that should’ve never been made in the first place. There’s some stuff that we simply shouldn’t mix if we’re trying to judge the chef fairly, and if we wish to get an informative and unbiased summary of a body of research, we have to ensure that the elements should actually be combined in the first place.
So, what should researchers do when they systematically review the literature, apply their inclusion and exclusion criteria, but find that the studies aren’t similar enough to justify combining their data? Once again, they should move forward with their systematic review, and simply forgo the calculation of a pooled quantitative analysis.
4. Are the measured outcomes similar enough to even think about combining them?
Every now and then, you’ll come across meta-analyses that cast a very, very wide net when searching the literature, or use very lax inclusion and exclusion criteria to determine which studies “make the cut” for analysis. In some cases, you’ll end up with studies that measure meaningfully different outcomes. For example, I wrote the following when reviewing the arginine meta-analysis in Volume 4:
“The analysis also includes at least one outcome that probably shouldn’t be categorized as a ‘performance’ outcome. In the study by Pahlavan, the Harvard Step Test was used to create a performance metric for the sample of trained soccer (football) players. For this test, you step up and down from a 20cm box for 5 minutes, at a cadence of 30 step-ups per minute. Your score for this test is calculated solely based on how rapidly your heart rate returns to normal after exercise. While this might be a decent proxy for general cardiovascular fitness levels in the general population, I’d hardly consider this a performance test in a sample of soccer (football) players, so I think this study probably should’ve been excluded from consideration.”
This is one particularly extreme example in which the purported performance outcome is simply not a performance outcome, but we wrestle with less extreme examples all the time. For example, a meta-analysis on strength outcomes has some important, context-specific decisions to make: based on the research question, can we really treat maximal isometric handgrip strength as being similar to a 10RM squat test? In an endurance-focused meta-analysis, can we really treat a three-minute endurance test as being similar to a two-hour endurance test? The answers to these questions are heavily context-dependent, but they should always be top of mind when reviewing an exercise-focused meta-analysis.
For another example, let’s revisit Greg’s review of a periodization meta-analysis (12) from Volume 1. When looking at the data, it was clear that there were some major outliers, which were subsequently removed from one version of the analysis. As Greg noted:
“Several of the effects eliminated weren’t ‘fair’ comparisons of periodized and non-periodized training. A few studies compared periodized resistance training versus non-periodized resistance training roughly equated for average intensity and volume versus single-set non-periodized resistance training. In those studies, you’d extract one effect for challenging periodized versus challenging non-periodized training, and one effect for challenging periodized versus incredibly easy non-periodized training. The first effect may have shown a slight benefit for periodized training, while the second effect may have shown a massive benefit for periodized training, though the second effect would be comparing apples and oranges. A couple other studies compared challenging periodized training to only single set non-periodized training.”
In this example, the meta-analysis would basically contain two different groups of effect sizes – the ones that compare periodized training to relatively similar non-periodized programs, and the ones that compare periodized training to dramatically less arduous training programs. In simple terms, these different types of effect sizes represent truly different things, and it would be ill-advised to combine them in a manner that treats them as equivalent metrics.
So, what should researchers do when they systematically review the literature, apply their inclusion and exclusion criteria, but find that the measured outcomes aren’t similar enough to justify combining their data? Once again, they should move forward with their systematic review, and simply forgo the calculation of a pooled quantitative analysis.
5. Have effect sizes been calculated correctly?
Effect sizes can take many forms – far too many to thoroughly explore in this section. If you’re interested in getting a sense of the common effect size outcomes used when comparing groups (the most common type of comparison observed in exercise science meta-analyses), be sure to check out this paper by Lakens (13). If you’re interested in exploring the broader spectrum of effect size metrics for meta-analyses (including observational correlations, dichotomous outcomes, and a variety of other analytical approaches), check out the supporting documentation for the R package called “metafor.” However, I want to provide a few key details to look out for when assessing effect size calculations.
First, there are standardized and unstandardized effect sizes. Every now and then, you’ll be dealing with a meta-analysis in which every study is truly measuring the same outcome (for example, weight loss in kilograms). When you can leave an effect size in its raw, unstandardized units, it’s the ideal route to take. However, we rarely have this luxury in exercise science; a group of “strength-focused studies” might measure, for example, bench press 1RM, squat 3RM, or maximal isokinetic leg extension. When this is the case, meta-analysts calculate a standardized effect size, which converts each metric into generic units that aim to describe the size of the effect relative to the standard deviation of the measurement. Most commonly, you’ll see papers report Cohen’s d values, Hedges’ g values, or generic “standardized mean differences.” These are all interpreted similarly, but you can read this paper to explore the distinctions among the various effect size metrics that fall under this umbrella.
Practically speaking, there are two primary issues to look out for. As discussed previously, some meta-analysts will calculate within-group effect size (change in treatment group, ignoring placebo group) when it would actually be more appropriate to calculate a between-group effect size (change in treatment group, relative to change in placebo group). A second common issue involves using the incorrect standard deviation value. Consider a scenario in which two groups (treatment group and placebo group) complete strength testing before and after an intervention. For each group, you could look at the baseline strength value, post-test strength value, or the change in strength from baseline to post-testing; for each value, you can calculate a mean and a standard deviation. In most cases, we’re primarily interested in the difference between the change in the treatment group and the change in the placebo group, scaled relative to the pooled (averaged) baseline standard deviation of both groups combined. Sometimes researchers will divide by the pooled standard deviation of the change value, rather than the pooled standard deviation of the baseline value. When reviewing the meta-analysis on arginine, I discussed an example of this error:
“It appears as if the analysis includes multiple different types of effect sizes, but treats them as if they’re the same. For Cohen’s d effect sizes (or in this case, Hedges’ g, which is very similar), you have the option to standardize based on raw standard deviations or change score standard deviations. Think of it this way: a group might bench 100 ± 20 kg at baseline, and a supplement might increase their bench press values by an average of 3 ± 5 kg. This gain of 3kg could be presented as an effect size of 3/20kg (raw score standardization) or 3/5kg (change score standardization). Obviously, these are different metrics with very different values.”
This is an oversimplified example calculation that focused on a single group (rather than comparing two groups and using pooled standard deviations), but you get the idea – this error leads to the calculation of a fundamentally different effect size metric, which tends to distort interpretation by inflating the apparent size of the effect.
6. Have they properly accounted for any samples contributing multiple effect sizes?
We’ve already discussed this error in detail, so I won’t elaborate much on what it is or why it’s an issue. However, we haven’t specifically discussed how researchers might address it. Some researchers might go into the software and manually adjust the sample size entry, standard error, or weighting of the analysis as a “rough and dirty” way of dealing with it. For example, instead of double-counting a study with 20 subjects, they might include both effect sizes but adjust the same sizes to be 10 each. A more nuanced approach would involve calculating a single aggregated effect size for the study that combines all of the individual effect sizes, such that it contributes only one “composite,” properly weighted effect size to the meta-analysis. An even more nuanced approach involves using a multi-level model, where multiple effect sizes can be statistically “nested” within a given study, such that each effect size contributes information to the model while being handled in a statistically appropriate manner (that is, this nested approach allows samples to contribute multiple effect sizes without exaggerating their influence on the model or inflating the precision of the effect size estimates). There are many different ways to address this issue with varying levels of nuance and sophistication, but the most important thing is that the researchers acknowledge it and take some defensible steps toward addressing it.
7. Have they used an appropriate statistical model?
This is a particularly vague question, but there are two important sub-questions that come to mind.
First, did they make the appropriate decision to use a fixed effect or random effects model? Most of the time, the random effects model is the way to go. Some people use a simplified heuristic that you should use a random effects model when the calculated heterogeneity value is high and a fixed effect model when calculated heterogeneity is low, but this decision is more theoretical than empirical, and should (in my opinion) be made before the numbers are crunched in the first place. The two approaches rest on fundamentally different assumptions about the nature of the analysis taking place, so researchers should wrestle with those assumptions before they complete the analysis itself.
As a reminder, studies recruit a sample from a population, and the hope is that the study will approximately estimate the population-level effect size. It won’t be perfect, but we can’t actually test the entire population of interest, so we make do. A meta-analysis tries to combine several different samples to obtain an even more refined estimate of the population-level effect size. This is where fixed effect and random effects models start to diverge.
A random effects analysis assumes that the studies in the meta-analysis are individually trying to estimate one effect size from a larger distribution or spectrum of “true” effect sizes. For example, the “true,” population-level effect size of an intervention might differ a little bit when comparing males to females, or younger subjects to older subjects. Or, key study characteristics might truly impact the “true,” population-level effect of an intervention, such as the dosage of a supplement or the duration of the study period. As such, a short study that sampled younger males might actually be trying to approximate a “true” effect size that is different from that of a long study sampling older females. A random effects meta-analysis calculates the statistical heterogeneity among these individual studies, incorporates that heterogeneity into the model, and aims to estimate the average value of the distribution of effect sizes in this literature, rather than estimating the singular “true” effect size. As you’ve probably inferred, a fixed effect analysis is the opposite. It assumes that there is one “true” effect being estimated by all of the studies in the analysis – one might even say that this effect size is fixed in nature, rather than varying based on key characteristics of the individual studies. This topic is subject to considerable debate, but my very oversimplified perspective is as follows: for most meta-analyses in our field, the random effects model is the more defensible choice, and should probably be the default selection unless you’ve got a particularly good reason to opt for a fixed effect model. However, when statistical heterogeneity is low (or there are too few studies to actually incorporate statistical heterogeneity into the model), the difference between the two approaches becomes minimal.
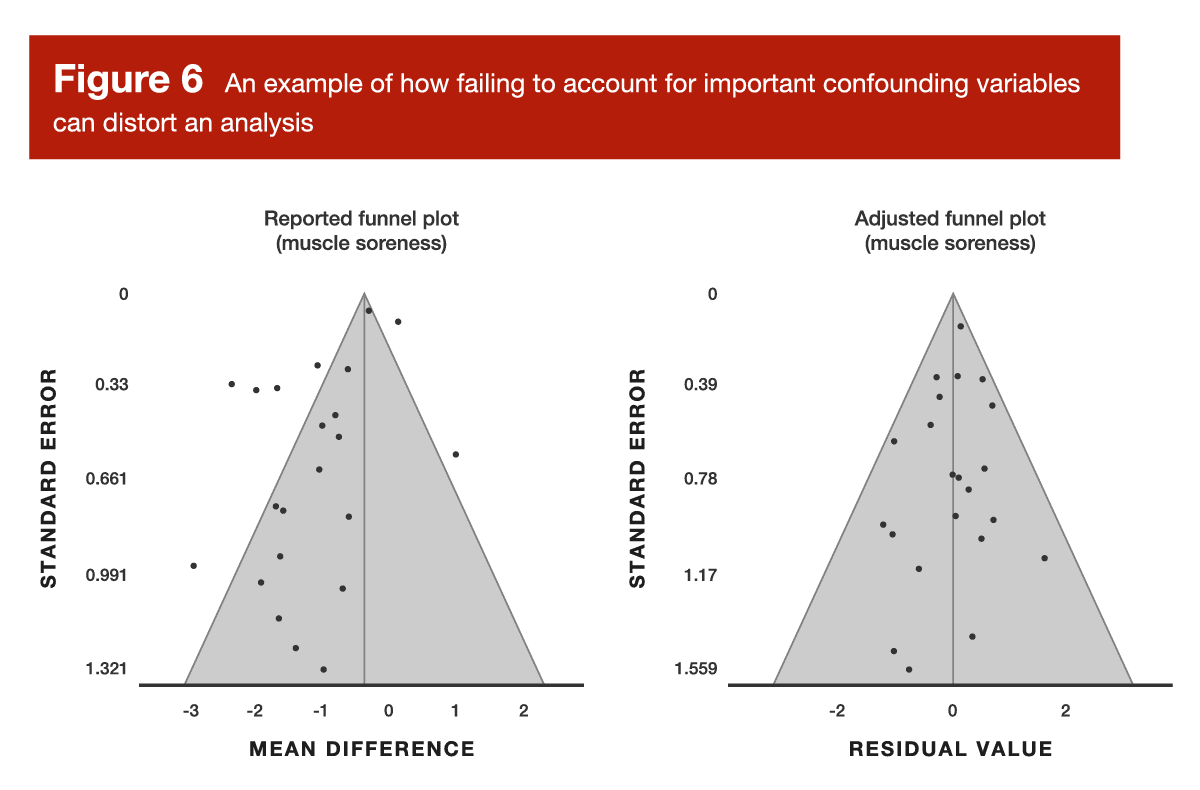
Now for the second sub-question: did the researchers appropriately account for key confounding variables in their analysis? The previously discussed meta-analysis about carnitine and exercise recovery is a great example of this. When looking at recovery outcomes at several different timepoints after exercise, the analysis failed to account for time-related changes (for example, we should absolutely assume that outcomes like creatine kinase levels and muscle soreness are going to change during the four-day period following an exercise bout, regardless of supplementation strategies). When neglecting to account for the effect of time, this analysis yielded a disastrous funnel plot, which was very effectively rectified by adjusting the model to incorporate the effect of time (Figure 6).
One of this month’s Research Briefs in MASS provides another great example. The researchers were constructing meta-regression models, which are a special type of meta-analytic model. Meta-regression is, essentially, exactly what it sounds like. Rather than focusing on simple group comparisons (for example, supplement versus placebo), meta-regression pools data from multiple studies to form a regression model, which instead focuses on how a particular predictor variable (which can be continuous, such as age or daily protein intake) influences an outcome, such as hypertrophy or strength gains. In this month’s Research Brief about predictors of resistance training adaptations in adults with overweight or obesity, the researchers presented two different types of meta-regression models: univariable (unadjusted models looking at how one variable impacts one outcome), and multivariable (models looking at how one variables impacts one outcome, while adjusting the model to account for several other confounding variables).
There are, of course, some other ways to address confounding variables without incorporating them directly into the primary meta-analysis model. For example, researchers might do “moderator tests,” where they statistically test to determine if a particular confounding variable meaningfully influences the results. Alternatively, they might do “subgroup analyses” to split the data into groups based on a particular variable of interest (such as, for example, age or sex), then analyzes each group separately to make indirect inferences about the impact of the grouping variable. An even simpler approach would be to use inclusion and exclusion criteria to eliminate the issue entirely. For example, if researchers think that training status has potential to totally distort their analysis, they might decide to exclude all studies including untrained participants before they even begin extracting data. In summary, there are many ways to address confounding variables; there are pros and cons for each approach, but the most important thing is that key confounding variables aren’t ignored and left unaddressed.
8. Are there any implausibly large effects, implausibly narrow confidence intervals, or outliers?
When I open up a meta-analysis, the first thing I do is check the forest plot and funnel plot. I’m initially scanning for unusually large effect sizes, unusually narrow confidence intervals, and massive outliers. If I see anything that looks peculiar, I follow up by looking at the tables presented in the meta-analysis and the full text of the original study that’s contributing the unusual data point to see if there might be a calculation error, misinterpretation, or a downright sketchy study in the mix. When researchers identify an outlier or an implausibly large effect, they have several options for addressing it. For example, they might lean on any number of statistical procedures that quantify the impact of the outlier on the analysis. They can also present multiple versions of the analysis – one including the outlier, and one omitting the outlier. A related procedure, called a “leave-one-out” analysis, takes this even further by removing every single study, one at a time. The researchers re-analyze the entire data set several times, with each analysis missing exactly one study; this allows researchers to determine if the presence of any particular study has a meaningful impact on the overall results of the analysis. I should also mention that there are some instances in which an outlier value is totally legitimate, and the researchers can identify contextual factors that led to the inflated effect size. Some researchers may choose to simply highlight this observation and qualitatively explain these contextual factors, which may or may not warrant removal from the data set. In summary, there are many viable ways to deal with outliers, but researchers certainly shouldn’t ignore them entirely.
9. Does the funnel plot actually look like a symmetrical funnel?
As noted previously, funnel plots provide a visual representation of some key statistical characteristics of the literature being summarized in a meta-analysis. In ideal circumstances (that is, scenarios in which the data conform to some important assumptions that increase our confidence in the results of the analysis), the data should “fan out” in a symmetrical, funnel-shaped pattern. We often talk about funnel plots when discussing publication bias, which is one factor (but not the only factor) that can cause asymmetry in a funnel plot. Small studies tend to require less time and resources to complete, so researchers sometimes decide not to publish small studies with underwhelming results. When you see an asymmetrical funnel plot, you can see a bunch of small studies reporting positive effects, but their “mirror image” counterparts in the funnel (that is, the small studies reporting less positive effects) seem to be missing. Whenever this occurs, we have very good reason to believe that the pooled effect size is biased and unrepresentative of the “true” effect size, so we should interpret the meta-analysis very, very cautiously. Funnel plots also give us a great opportunity to identify outliers or noteworthy data patterns that threaten the robustness of the meta-analysis. For example, if the plot totally lacks a funnel-shaped structure, or you’ve got one data point way out in left field, or a large part of the funnel seems “shifted” to the side, or there appears to be two different funnel shapes forming within the same plot, you’ve got some data issues that require serious probing.
A visual scan of the funnel plot is always a great first step, but some researchers may choose to use statistical tests to determine if there is statistically significant funnel plot asymmetry. A couple of examples include Begg’s rank test and Egger’s regression test. While these are great tests, it’s important to note that they are often underpowered in exercise science meta-analyses; as a result, we can’t assume that a non-significant test results totally rules out the possibility of issues related to funnel plot asymmetry. Another common approach is to use the “trim and fill” method. This procedure examines the funnel plot, determines if there are “missing studies” (for example, an asymmetrical plot with too many studies on the right would be “missing” studies on the left), and retroactively fills in the missing studies that theoretically should exist (I’m using extremely simplistic terminology here, but you get the idea). In other words, it adjusts the analysis in a manner that tries to correct for the funnel plot asymmetry that is present. I’ve spoken to some pretty knowledgeable folks who argue that this procedure tends to undercorrect (meaning that in many cases, it doesn’t adjust quite enough to fully offset the observed funnel plot asymmetry), but it’s still a common and viable option that’s often better than nothing. I suspect that we’ll see more robust and more sophisticated solutions for dealing with funnel plot asymmetry over the next 10-20 years, but my aim in this section is to cover the most common approaches you’re likely to encounter in the literature. This is yet another scenario in which researchers have plenty of defensible options for adequately addressing the issue, but it would be ill-advised to ignore the issue altogether.
10. Is there a great deal of unexplained heterogeneity?
When discussing fixed and random effects models, I mentioned the concept of statistical heterogeneity. You’ll see researchers report heterogeneity in a variety of different ways, but the two common methods include the Cochrane Q statistic or the I2 value. We could get bogged down in a bunch of equations and Greek letters, but this concept is actually pretty intuitive when kept at the surface level. Imagine you’re interested in trying a supplement that’s supposed to increase strength performance, and you’ve got 12 very similar studies testing its effectiveness. The average effect size is d = 0.2, which isn’t too bad for a dietary supplement. However, there are a few studies (not just one or two flukes) reporting pretty large reductions in performance, and a few studies (not just one or two flukes) reporting remarkably large improvements in performance. Before you can have any confident expectation of how that supplement might impact your performance, you need to dig into those inconsistencies.
Perhaps all of the large effects (both negative and positive) tend to be the smaller studies with less precise effect estimates, and the funnel plot looks totally fine. If so, no big deal. Perhaps you can identify a specific study characteristic (such as the population sampled, the supplement dose, or the type of exercise being tested) that fully explains the inconsistencies. If so, you now know the specific scenarios in which you might expect performance improvements. Perhaps the funnel plot is a mess, but you are unable to identify any specific study characteristics that explain the inconsistencies. If so, that’s an issue – the pooled effect size of d = 0.2 doesn’t do much for us if we can’t predict the scenarios that yield large negative effects, large positive effects, or fairly neutral effects. Heterogeneity isn’t always a huge issue, but unexplained heterogeneity should lead us toward an extremely cautious interpretation of the findings.
Wrapping up
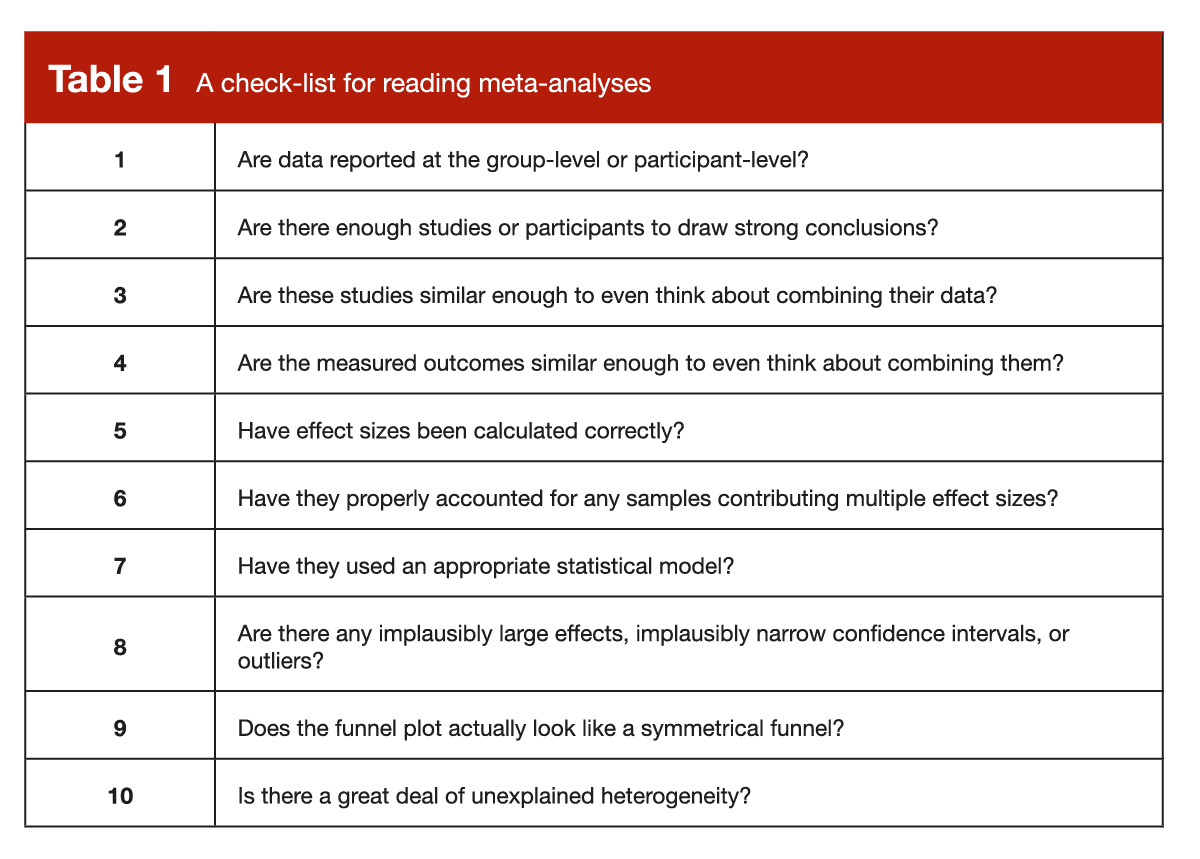
Admittedly, this is a long list of things to check as you’re working your way through a meta-analysis. To make things a little easier and more organized, I have arranged them in a comprehensive checklist (Table 1), which you can hold onto for safekeeping and future reference.
Concluding remarks
This project falls under the umbrella of meta-science and error detection, which may sometimes seem like a bunch of know-it-alls trying to boost their own egos by nitpicking others in a condescending manner. I am very confident that this was not the motivation behind the presently reviewed paper, and it’s certainly not the intention of this MASS article. A primary purpose of research is to work incrementally toward robust answers to important questions; erroneous or suboptimal research methods detract from this purpose, and the people working to identify key errors and pragmatically suggest better methods are filling a critically important role in the scientific community.
This type of work isn’t done by perfect researchers who are looking down on others with a perceived sense of superiority. Like many researchers I’ve talked to, I tend to cringe a little bit when I look back at some of my first research publications. Not because they are absolutely dreadful or fatally flawed, but because I’ve learned plenty of stuff over the years, so I know I’d do a better job if I re-did the project today. It’s like asking an experienced coach if they do anything differently in their 10th year of coaching when compared to their first year – I certainly hope the answer is yes. Frankly, if a researcher doesn’t look back at some of their earliest work and cringe a little bit, there are three potential reasons that come to mind: 1) they are an absolute savant (probably not), 2) they are in denial, or 3) they stopped learning and growing as a researcher. The presently reviewed paper aims to proactively address reasons #2 and #3 by shining a light on the high prevalence of errors (to help people overcome their denial), and by providing guidance to help researchers circumvent common errors in the future. While this can cause some growing pains, the short-term discomfort is certainly worth the long-term improvement of research quality. If we wish to have a thriving field built upon reliable research, scientists must maintain the humility required to constantly revisit their approaches and improve them when necessary.
Acknowledgments
While this isn’t a standard section of MASS articles, I wanted to briefly acknowledge Dr. Charlie Poole. As a member of the Cochrane Collaboration statistical methods group, there are few people walking the planet who can match his expertise in the realm of meta-analysis. During graduate school, I had the great pleasure of taking his semester-long course on systematic reviews and meta-analyses. If I made any good points in this article, it’s because of him; if I made any bad points (hopefully not), it’s because I oversimplified his nuanced instruction in a heavy-handed manner. I was really lucky to have access to his course, and I hope this article relays a fraction of that experience to those who read it.
Next Steps
Now, we wait. Over the next few years, I expect the quality of meta-analyses in our field to improve dramatically. I’ve been keeping tabs on this issue for a few years now, and I’ve already observed substantial improvement (the bad metas are still pretty bad, but a rising tide seems to be lifting the quality of the metas that fall in the average-to-excellent range). In fact, the rate of improvements seems to be accelerating (as far as I can tell), and the really savvy meta-analysts are pushing their analyses to increasingly impressive levels of nuance and rigor.
Application and Takeaways
Systematic reviews and meta-analyses are rightfully placed at the very top of the hierarchy of evidence, but that doesn’t mean we should let our guard down and uncritically accept their findings. When you’re reading a meta-analysis, it’s important to approach it with the same level of scrutiny you’d apply to any other piece of research. My hope is that the checklist provided in this article will facilitate your meta-analysis reading endeavors. After working through the information in this article, the Stronger By Science master list of systematic reviews and meta-analyses should now be more accessible than ever. In addition, if you’d like to take your knowledge of meta-analyses even further using some free resources, I suggest that you check out the Cochrane Collaboration handbook, the introductory textbook by Borenstein and colleagues, and the supporting documentation for the R package called “metafor,” which is my unequivocal recommendation for software if you’re planning to conduct a meta-analysis yourself. If you prefer to watch videos rather than reading text, there are also many helpful tutorials available on YouTube.
Get more articles like this
This article was the cover story for the December 2022 issue of MASS Research Review. If you’d like to read the full, 150-page December issue (and dive into the MASS archives), you can subscribe to MASS here.
Subscribers get a new edition of MASS each month. Each edition is available on our member website as well as in a beautiful, magazine-style PDF and contains at least 5 full-length articles (like this one), 2 videos, and 8 Research Brief articles.
Subscribing is also a great way to support the work we do here on Stronger By Science.
References
- Kadlec D, Sainani KL, Nimphius S. With Great Power Comes Great Responsibility: Common Errors in Meta-Analyses and Meta-Regressions in Strength & Conditioning Research. Sports Med. 2022 Oct 8; ePub ahead of print.
- Henderson J. The Plato of Praed Street: the Life and Times of Almroth Wright. J R Soc Med. 2001 Jul;94(7):364–5.
- Pearson K. Report on Certain Enteric Fever Inoculation Statistics. Br Med J. 1904 Nov 5;2(2288):1243–6.
- Viribay A, Burgos J, Fernández-Landa J, Seco-Calvo J, Mielgo-Ayuso J. Effects of Arginine Supplementation on Athletic Performance Based on Energy Metabolism: A Systematic Review and Meta-Analysis. Nutrients. 2020 May 2;12(5).
- Yarizadh H, Shab-Bidar S, Zamani B, Vanani AN, Baharlooi H, Djafarian K. The Effect of L-Carnitine Supplementation on Exercise-Induced Muscle Damage: A Systematic Review and Meta-Analysis of Randomized Clinical Trials. J Am Coll Nutr. 2020 Jul;39(5):457–68.
- Han Q, Li X, Tan Q, Shao J, Yi M. Effects of vitamin D3 supplementation on serum 25(OH)D concentration and strength in athletes: a systematic review and meta-analysis of randomized controlled trials. J Int Soc Sports Nutr. 2019 Nov 26;16(1):55.
- Hadzic M, Eckstein ML, Schugardt M. The Impact of Sodium Bicarbonate on Performance in Response to Exercise Duration in Athletes: A Systematic Review. J Sports Sci Med. 2019 Jun;18(2):271–81.
- Morton RW, Murphy KT, McKellar SR, Schoenfeld BJ, Henselmans M, Helms E, et al. A systematic review, meta-analysis and meta-regression of the effect of protein supplementation on resistance training-induced gains in muscle mass and strength in healthy adults. Br J Sports Med. 2018 Mar;52(6):376–84.
- Lawrence JM, Meyerowitz-Katz G, Heathers JAJ, Brown NJL, Sheldrick KA. The lesson of ivermectin: meta-analyses based on summary data alone are inherently unreliable. Nat Med. 2021 Nov;27(11):1853–4.
- Gao X, Zhang H, Guo XF, Li K, Li S, Li D. Effect of Betaine on Reducing Body Fat-A Systematic Review and Meta-Analysis of Randomized Controlled Trials. Nutrients. 2019 Oct 16;11(10).
- Trexler ET, Persky AM, Ryan ED, Schwartz TA, Stoner L, Smith-Ryan AE. Acute Effects of Citrulline Supplementation on High-Intensity Strength and Power Performance: A Systematic Review and Meta-Analysis. Sports Med. 2019 May;49(5):707–18.
- Williams TD, Tolusso DV, Fedewa MV, Esco MR. Comparison of Periodized and Non-Periodized Resistance Training on Maximal Strength: A Meta-Analysis. Sports Med. 2017 Oct;47(10):2083–100.
- Lakens D. Calculating and reporting effect sizes to facilitate cumulative science: a practical primer for t-tests and ANOVAs. Front Psychol. 2013 Nov 26;4:863.