
If you stumbled upon this article randomly, just know from the outset that it is mainly supplemental material for this article, and it probably won’t make much sense if you try to read it by itself.
I found 20 studies that directly compared different rep ranges and intensity zones. Seven of them weren’t usable for various reasons (reasons for exclusion will be explained below). Of the remaining 13, there were 23 direct comparisons between different rep ranges for hypertrophy in various muscles – nine comparing low reps to moderate reps, and 14 comparing high reps to moderate reps.
In a few instances, I combined multiple measurements so that no individual studies would have undue weight in the analysis when looking at percent differences. For example, one study comparing low reps to moderate reps measured muscle growth in the quads in three different locations; I averaged the three measurements instead of leaving them separate because otherwise quad measurements in a single study would have comprised almost 30% of the comparison between low and moderate reps. I could do this when looking at percent differences (first and third comparison), but not for effect sizes (second comparison), so if you’re curious about why there aren’t the same number of data points in each comparison, that’s why.
Here’s the full spreadsheet I used to analyze the data if you want to play around with it. It’s pretty rough because I was just making it for my own purposes, so not everything is labeled. If you have a question about it, just ask.
This article sought to compare rep ranges quantitatively. Qualitatively, we can sum it up in one sentence: Of the 20 studies comparing one rep/intensity zone to another that were roughly equated based on relative volume or number of hard sets, 17 reported no significant differences in hypertrophy in the most relevant comparison groups.
However, I wanted to attempt to take things a step further so you can visualize the differences (and lack thereof) when looking at the big picture.
These first two comparisons are probably the fairest “apples to apples” comparisons between the studies to nullify the different ways muscle growth was compared. For example, one study may report changes in muscle thickness and be comparing a 15.24% increase to a 12.72% increase, whereas another may be reporting changes in arm circumference, and be comparing a 2.1% increase to a 2.44% increase.
In this first comparison, we ask ourselves, “How much did the results of the ‘hypertrophy range’ group compare to the average results in the study as a whole?” The muscle growth in the “hypertrophy range” group was subtracted from the average results across both groups reported, and that value was divided by the average results across both groups.
So, in the study measuring muscle thickness, the average increase was 13.98%. The moderate-rep group’s increase in muscle thickness was 12.72%. Then, that was divided by 13.98%. The result is 9%. Since it’s positive, that means the low-rep group in that study beat out the moderate-rep group. (The average participant in the whole study grew more than the average participant in just the moderate-rep group.)
Applying the same process to the study measuring arm circumference, you wind up with a result of -7%, meaning the average participant in the moderate-rep group’s arms grew about 7% more than the average participant in the study as a whole. This process gives us similar-sized numbers to compare, versus just finding the difference in percent growth in each study.
Additionally, comparing group averages to study averages helps smooth out the effects of outliers that would unduly sway the comparison. For example, in one study comparing low and moderate reps, the low-rep groups’ hamstrings thickness increased roughly 3x more (186%, to be exact) than the moderate rep groups’. In another study, the moderate-rep groups’ muscle fibers increased in cross-sectional area roughly 5x as much (371% more, to be exact) as the high-rep groups’.
When you drop those types of differences into an analysis of a bunch of different studies, that one extreme value will either single-handedly sway the results, or otherwise it just needs to be excluded. However, when comparing to group means, the effects of those outlier results are toned down. Instead of 186% and 371% differences between groups throwing the cumulative averages by 20+ percentage point, you’re left with 48% and 65% differences from study means, which only shifts things by about 5 percentage points.
I reported both adjusted and unadjusted differences for this analysis. The unadjusted differences are pulled straight out of the studies themselves, and the adjusted differences are an attempt to correct for differences in number of sets and rest periods between studies. Those adjustments will be discussed below. In general, these adjustments gave an edge to moderate reps over low reps, and high reps over moderate reps.
The second comparison based on effect sizes (Cohen’s d) also seeks to correct for the differences in the types of measurements being done.
Effect size is a measure of the size of the change relative to the variability within a group. So, for example, if quad thickness was 5cm with a standard deviation of .5cm to start with, and 6cm with a standard deviation of .5cm at the end of the study, the effect size would be 2.
If, on the other hand, quad thickness increased from 5cm to 6cm, but the standard deviation was .8cm, the effect size would be 1.25. If the standard deviation was only .3cm, the effect size would be 3.33. Since measurements that report larger percent changes tend to have larger variability, and measurements that report smaller percent changes tend to have smaller variability, effect sizes give you a pretty fair comparison. All effect sizes are based on unadjusted data, with no measurements combined.
In general, an effect size or a difference in effect sizes of 0.2 or less is considered a “small” change, so below that, I counted it as a tie, and above that, I counted it as a difference.
If this were an actual meta-analysis I would have treated the effect sizes a bit differently, but I don’t have meta-analysis software and all of the necessary calculations would be horrible in Excel. Not worth it for a blog post.
The third comparison is probably the least appropriate, but it’s the most straightforward and easy to understand. It’s just percent difference between the studies with no attempt to correct for measurements that report difference changes in magnitude.
For percent difference, I counted anything as a tie when the difference in average muscle growth was less than 10%. So, for example, if one group’s quad thickness increased by 10%, and another group’s increased by 10.5% (a 5% difference), I counted that as a tie. If, on the other hand, it was 10% vs. 13% (a 30% difference), I counted it as a win for the rep range with 13% growth. In these comparisons, I’m looking for relevance, not necessarily statistical significance; there were statistically significant differences reported in only three of the studies in this analysis (discussed below).
All of the charts and graphs for this comparison are based on adjusted data, but unadjusted figures are reported as well.
The adjustments were made to address differences between training protocols that would likely affect hypertrophy. Since I wanted to see if rep range impacted muscle growth per unit of effort invested (per set, basically), I wanted to control for the effects of other factors that have been shown to impact muscle growth: rest periods and number of sets.
The adjustments helped out low reps when compared to moderate reps, and moderate reps when compared to high reps since heavier work tended to be accompanied by more sets and longer rest times.
Before discussing the adjustments, I’d like to reiterate that the adjustments didn’t change the big picture. There were no significant differences between low, moderate, and high reps either before or after adjustments in the first or third analyses, and everything above dealing with effect sizes was based on unadjusted figures anyways.
To adjust for number of sets, I referred to Kreiger’s 2010 meta-analysis. When looking at hypertrophy, the effect size for 1 set was 0.24, the effect size for 2-3 sets was 0.34, and the effect size for 4-6 sets of 0.44. I assumed that the meta-analysis dealt with enough studies that differences in standard deviations wouldn’t throw things off too much, so that I could treat the effect sizes as proxies for degree of hypertrophy. Most of the studies in that meta-analysis used a frequency of 2-3 days per week per muscle group, as did most of the studies in this article.
I plotted the effect sizes at three points [(1, 0.24), (2.5, 0.34), (5, 0.44)] and found the parabolic line of best fit. I chose a parabolic line of best fit to incorporate the understanding that volume can get too high, and that the hypertrophic effect of adding more and more sets will decrease over time, until eventually you have a marginal decrease in hypertrophic effect for each set added.
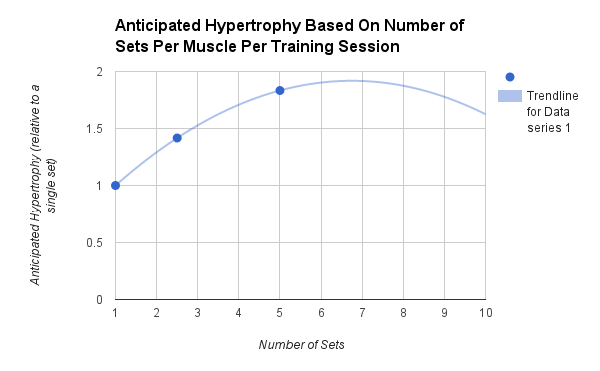
Based off that curve, you can predict how much additional growth you can expect with each set added.
| Sets | Hypertrophy (unitless) |
| 1 | 1 |
| 2 | 1.291 |
| 3 | 1.526 |
| 4 | 1.705 |
| 5 | 1.828 |
| 6 | 1.895 |
| 7 | 1.906 |
| 8 | 1.861 |
So, you’d expect about 53% more growth doing three sets instead of one set, or about 24% more from doing six sets instead of three sets. These number seem to match up pretty well with Peterson and Rhea’s recommendations for advanced lifters; they recommend eight sets, which is near the peak of the curve.
Adjusting for rest periods was less straightforward, but fortunately only three of the studies included in this analysis had differences in rest periods that were likely to be meaningful for hypertrophy.
A 2014 review by Henselmans found that most studies with different rest periods report that rest periods don’t affect hypertrophy at all, but that one study had reported less muscle growth in the group with shorter rest periods.
Looking at a few of the more relevant studies individually, Buresch and Schoenfeld found that resting 1 minute caused only about half the hypertrophy as resting 2.5 minutes and 3 minutes, respectively. On the other hand, Ahtiainen found no significant differences comparing 2 minute to 5 minute rest periods, and while hypertrophy wasn’t assessed in this study, Willardson found no differences in strength gains over 6 months when comparing 2 minute to 4 minute rest periods. So, for my adjustments, I increased anticipated hypertrophy for the group with shorter rest intervals if those rest intervals dipped below 2 minutes.
Individual Studies
To make sure no individual study or measurement skewed the results too much, I removed one at a time from the analysis, and re-checked unadjusted measurements for effect size and percent differences, and adjusted measurements for percent differences. For the studies where only changes in CSA for each fiber type were reported, I compared analyses using estimates of the change in “average” fiber CSA to analyses using changes in CSA for each fiber type; the distinction did not impact the results of the analysis, so I went with estimates of change in “average” fiber CSA to reduce the impact of any single study on the overall analysis. The only study that had a major independent effect on the results was Schuenke’s. Removing it removed the trend toward significance for moderate loads over low loads. All of the judgement calls made were in the interest of 1) being able to compare studies quantitatively and 2) not allowing any single study with similar measurements of a single muscle to get undue weight in the analysis.
Author: Schoenfeld
Training Status: Trained
Muscle(s) examined: Biceps
Sets/Reps compared: 7x3rm vs. 3x10rm
Increase in muscle size: 12.18% for 7×3, 12.17% for 3×10
Significant difference? No
Adjustments: Number of sets; rest periods
Author: Campos
Training Status: Untrained
Muscle(s) examined: Quads
Sets/Reps compared: 4×3-5rm, 3×9-11rm, 2×20-28rm
Increase in muscle size: 19.9% for 3-5rm, 17.1% for 9-11rm, and 10% for 20-28rm
Significant difference? Not between 3-5rm and 9-11rm, but both of these groups experienced better results than then 20-28rm group.
Adjustments: Difference in sets
Issues/Judgement Calls: Changes in CSA for each fiber type were reported, along with proportion of each fiber type. To get an idea of changes in CSA for the “average” fiber, I took weighted averages (% Type I x Type I CSA + % Type IIa x Type IIa CSA + % Type IIx x Type IIx CSA). This is not a 100% accurate way to assess changes in whole-muscle CSA. Excluding this study from my analysis would not have changed the overall results, though. Changes in CSA for each fiber type were used for effect sizes.
Title: Resistance Exercise Load Does Not Determine Training-Mediated Hypertrophic Gains in Young Men
Author: Mitchell
Training Status: Untrained
Muscle(s) examined: Quads
Sets/Reps compared: 3 sets to failure with 80%1rm vs. 3 sets to failure with 30% 1rm
Increase in muscle size: 6.8% for 80% and 6.01% for 30%
Significant difference? No
Adjustments: None
Author: Van Roie
Training Status: Untrained
Muscle(s) examined: Quads
Sets/Reps compared: 4×10-15 at 80%1rm vs. 2×80-100 at 20%1rm vs. 2x(60 at 20%1rm, followed directly by 10-20 at 40%1rm)
Increase in muscle size: 3.2% for 80%1rm, 2.6% for 20%1rm, 2.4% for 20+40%1rm
Significant difference? No
Adjustments: Difference in sets
Issues/Judgement Calls: So this study wouldn’t be effectively counted twice when looking at percent differences, the two low-load groups were combined, for an average increase of 2.5%.
Author: Schoenfeld
Training Status: Trained
Muscle(s) examined: Biceps, Triceps, and Quads
Sets/Reps compared: 3×8-12rm vs. 3×25-35rm
Increase in muscle size: 5.3%, 6%, and 9.3% increases for biceps, triceps, and quads for 8-12rm, and 8.6%, 5.2%, and 9.5% increases for biceps, triceps, and quads for 25-35%rm
Significant difference? No
Adjustments: None
Title: Gross Measures of Exercise-Induced Muscle Hypertrophy
Author: Weiss
Training Status: Untrained
Muscle(s) examined: Quads and Hamstrings
Sets/Reps compared: 3×3-5rm vs. 3×11-13rm vs. 3×23-25rm
Increase in muscle size: +0.61cm for quads and +0.4cm for hamstrings with 3-5rm, +0.43cm for quads and +0.14cm for hamstrings with 11-13rm, +0.55cm for quads and +0.2cm for hamstrings with 23-25rm
Significant difference? Significant increases for quads for all groups, with no differences between groups. Increase in hamstrings thickness was not significant for any group.
Adjustments: None
Issues/Judgement Calls: Thigh girths were also reported. However, I didn’t find them to be compatible with the other measurements. Thigh girth was reported to increase twice as much in the 11-13rm and the 23-25rm group compared to the 3-5rm group, in spite of muscle thicknesses increasing slightly more in the 3-5rm group than the other two groups. Since measurements of muscle thickness are a more reliable indicator of hypertrophy than limb girths, I excluded this measurement from my analysis. Since the percent increase and effect size in this measurement was small for all groups, this exclusion did not affect the outcome of the analysis. Additionally, only changes in muscle thicknesses were reported, but not pre- and post- measurements. To compute percent increases, I needed to find thickness measurements in a similar population. I felt confident including percent changes in muscle thickness in my analysis because the variation in muscle thicknesses in untrained populations is pretty small, and deviations within that range would not have meaningfully effected the percent increases. Excluding this study would not have changed the results of the analysis. However, because pre- and post- measurements were not included, effect sizes could not be computed for this study.
Author: Chestnut
Training Status: Untrained
Muscle(s) examined: Biceps, Triceps, and Brachialis combined CSA, and arm girth
Sets/Reps compared: 6x4rm vs. 3x10rm
Increase in muscle size: 2.1% increase in flexed arm girth, and 8.24% increase in CSA for 6×4. 2.44% increase in flexed arm girth and 8% increase in CSA for 3×10
Significant difference? No
Adjustments: Number of sets
Issues/Judgement Calls: Pre- and post- measurements for CSA weren’t reported. I could still use CSA for the percent change analysis by running the chart through webplotdigitizer (which is incredibly accurate), but I couldn’t use CSA for the effect size analysis because I didn’t know the pre- and post- standard deviations. Additionally, CSA was reported at two different points on the arm, but there were no meaningful differences between the two measurements, so I only included one in the analysis to not give this study undue weight. Arm girths were reported flexed and unflexed as well; I only used one of them for the same reason, and went with flexed because flexed is obviously cooler than unflexed.
Author: Klemp
Training Status: Trained
Muscle(s) examined: Quads and Pecs
Sets/Reps compared: 4×12, 4×10, and 5×8 for group 1, and 8×6, 9×4, and 10×2 for group 2
Increase in muscle size: 12.72% increase in pec CSA and 11.15% average increase in quad CSA for group 1, and 15.24% increase in pec CSA, and 11.23% average increase in quad CSA for group 2.
Significant difference? No
Adjustments: Number of sets
Issues/Judgement Calls: Muscle thicknesses were reported at three different places in the quads. For the percent difference analysis, I averaged the difference to not give one group of lifters’ quads undue weight in the analysis. I kept them separate for the effect size analysis (so I could calculate effect sizes). Since the lifters weren’t doing the same sets and reps on each day, I took the averages when adjusting for number of sets (4 vs. 9).
Title: Maintenance of Myoglobin Concentration in Human Skeletal Muscle After Heavy Resistance Training
Author: Masuda
Training Status: Untrained
Muscle(s) examined: Quads
Sets/Reps compared: 5×2 at 90%1rm vs. 3 rest-paused sets of 80-70-60%, 70-60-50%, and 60-50-40%.
Increase in muscle size: 12.3% increase for 5×2, and 16.28% increase for the rest-paused group
Significant difference? No
Adjustments: None
Issues/Judgement Calls: I excluded a similar study by Choi published in a Japanese journal because the measurements were all identical, so I’m assuming both studies were based on the same data. The percent change analysis was based on weighted averages from fiber sizes (like Campos). The effect size analysis was based on the individual fiber types. I treated the rest-paused group at “moderate rep” because each rest-paused set started in the “hypertrophy range” for intensity but total reps per set weren’t reported.
Author: Ogasawara
Training Status: Untrained
Muscle(s) examined: Pecs and Triceps
Sets/Reps compared: 3×10 at 75% vs. 4 sets to failure at 30%
Increase in muscle size: 17.6% increase in pec CSA and 11.9% increase in triceps CSA for 75%, 21.1% increase in pec CSA and 9.8% increase in triceps CSA for 30%
Significant difference? No
Adjustments: Number of sets
Title: Neuromuscular adaptations after 2- and 4-weeks of 80% versus 30% 1RM resistance training to failure
Author: Jenkins
Training Status: Untrained
Muscle(s) examined: Biceps
Sets/Reps compared: 3 sets to failure with either 80% or 30%
Increase in muscle size: 6.6% for 30%, and 8.59% for 80%
Significant difference? No
Adjustments: None
Issues/Judgement Calls: Biceps CSA was measured at three different points in the muscle. For percent difference analysis, I took the average of the measurements. For effect size analysis, I used all three. I only used the data after 4 weeks, and disregarded the data after 2 weeks.
Author: Popov
Training Status: Untrained
Muscle(s) examined: Quads and Glutes
Sets/Reps compared: Seven sets to failure with 80%1rm one day per week and three sets to failure with 80% two days per week vs. four rest-paused sets (three mini sets with 30 seconds in between) with 50%1rm one day per week and one rest-paused set with 50% two days per week.
Increase in muscle size: 15% increase for quads and 18% increase for glutes with 80%, and 6% increase for quads and 13% increase for glutes with 50%
Significant difference? No
Adjustments: number of sets
Issues/Judgement Calls: I decided to count the rest-paused sets as a single set, since rest-paused sets haven’t been shown to increase hypertrophy in the literature. I also had to average the number of sets performed each day (which didn’t work out to nice round numbers; I settled on 4 vs. 2).
Author: Schuenke
Training Status: Untrained
Muscle(s) examined: Quads
Sets/Reps compared: 9×6-10rm vs. 9×20-30rm
Increase in muscle size: 35.3% for 6-10rm vs. 7.5% for 20-30rm
Significant difference? Yes
Adjustments: None
Issues/Judgement Calls: There were three groups in the study, and I only compared two. One group was differentiated by an exceptionally slow rep cadence. For the percent change, I used weighted averages based on change in CSA of each fiber type (like Campos). For effect sizes I used each fiber type.
Studies Excluded:
Mangine – I had to exclude this one because initial measurements weren’t listed. The groups were similar to start with, so their data was pooled together and treated as a covariate. This study compared 4×3-5 at 90%1rm to 4×10-12 at 70%1rm. Hypertrophy was similar overall, and increases in lean arm mass favored the 90%1rm group. However, rest periods weren’t equated (3 minutes for 90% and 1 minute for 70%).
Two by Tanimoto (one, two) – Both of these studies compared training at 80-90% vs. training at 55-60%. However, the groups training at 55-60% lifted at a very slow cadence, so reps per set were similar. These studies do provide valid comparisons of different intensity ranges (there were no significant differences in hypertrophy between the 80-90% groups and the 55-60% groups), but since the rep ranges were similar, I left them out.
Holm – 10×8 at 70% with ~3 minutes between sets vs. 10 sets of 36 singles with 15.5%1rm with 5 seconds between reps and ~30 seconds between sets. I excluded this study because it was just weird, and not very reflective of how people actually train. I’ve never met someone who does 360 singles with 15.5% of their 1rm in a training session.
Leger – The methods mirrored the 3-5rm and 20-28rm groups in Campos (4×3-5rm with 3 minutes between sets vs. 2×20-28rm with 1 minute between sets). The increases in strength and hypertrophy were similar between groups, so they pooled them together for the analysis they actually cared about (looking at various signaling pathways). Therefore, I couldn’t get a comparison between the groups. There was another study by Lamon based on the same data, but it also didn’t allow for comparison between groups.
Alegre – Unilateral training with different protocols for each leg. One leg did 3×6 at 80% for most of the study (they had introductory weeks at 50%, 60%, and 70%, before settling at 80% for the rest of the study) and one leg stayed at 50% loads and did the same amount of mechanical work. Increases in quad CSA and quad muscle volume were similar between groups. I excluded this study because intensity of effort was not matched between groups; neither group trained to failure, and rate of perceived exertion was higher for the 80% leg than the 50% leg. I was on the fence about excluding this one since I included Ogasawara, in which one group did sets of 10 at 75%, and the other group trained to failure at 30%, but I ultimately decided to include Ogasawara because 75% tends to be around a 10rm load for most people, so even though failure wasn’t the defined end-point for the 75% group, it was clear that both groups were still training at least near failure, whereas it was unclear how close to failure the 50% group was in Alegre’s study.
Kraemer – This study compared four periodized strength training plans. Two were full body programs, and two were upper body programs. One full body program and one upper body program stayed in the 3-8 rep range, while the other two programs stayed in the 8-12 rep range. Upper body muscle growth was similar in all four programs, and lower body muscle growth was similar in both full body programs. This study was excluded because, as far as I can tell, the actual actual exercise selection was different in each program.
Out of these seven excluded studies, there were only significant differences between groups in two of them. Holm measured quad CSA in three different places, and the 70% group had more growth than the 15.5% group at one of the three measurement sites; Mangine included a bunch of different measurements of muscle growth, and the only significant difference was in lean arm mass, favoring the 3-5 rep group over the 10-12 rep group. I feel confident in my decision to exclude these (for the reasons given above), but including them wouldn’t have changed things very much.
Other Random Thoughts and Observations
Hey, you’re still here!
Do the effects of each rep range change with training status?
It’s hard to say, because not many of these studies used trained participants: only three that I included in my analysis (Klemp’s and both by Schoenfeld) and one I excluded (Mangine’s).
Only one compared moderate reps to high reps (Schoenfeld’s). It found that when the number of hard sets were equated, hypertrophy was similar.
Three compared low reps to moderate reps. Two of them (Klemp and Schoenfeld) equated volume load, and one (Mangine) equated number of sets, but had different rest periods. All three reported similar hypertrophy. It could be that volume load or relative volume is more predictive of when comparing low reps and moderate reps for trained participants (meaning you’d need to do more low-rep sets to get the same hypertrophic effect); this idea is supported by Schoenfeld and Klemp’s studies, and opposed by Mangine’s, though since rest periods weren’t equated in Mangine’s, the moderate rep group may have been disadvantaged.
Do effects vary by muscle group?
There’s not enough data here to say for sure. However, we can look at Wernbom’s done-response study for some clues. Here’s muscle growth per day for the quads.
Maybe the average effects around 70-80%1rm are slightly better if you squint just right? However, I’m not seeing a clear trend. Also worth noting: The study with the highest rate of muscle growth in his analysis was left off of this chart because training frequency was dramatically higher (2-3x per week for most of these studies. The study excluded had a frequency of 12x per week). It used a 20% 1rm load with an increase in CSA of about 0.55% per day, which muddies the waters even further.
Here’s muscle growth per day for the biceps.
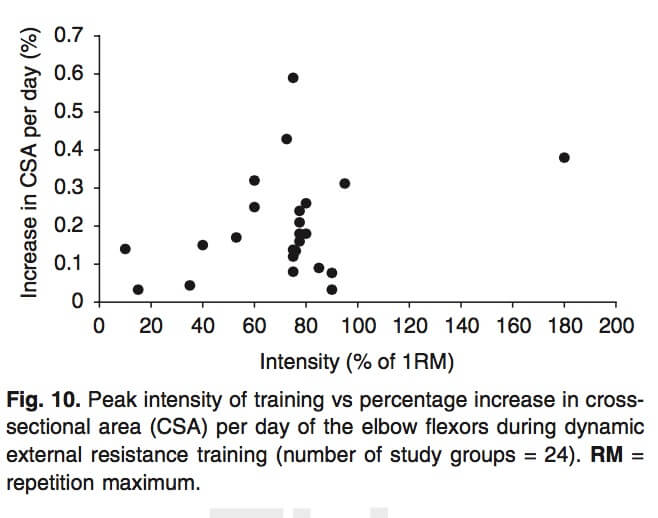
Here there does seem to be a trend for intensities around 60-80% 1rm to produce slightly better results. Maybe there is truly a “hypertrophy range” for your biceps. Or maybe super maximal eccentrics with 180% 1rm are the ticket to 18-inch arms (sarcasm). However, it’s worth noting that the studies on this chart used a really wide array of protocols and subjects, so the points on this chart aren’t comparing apples to apples.
Finally, I’m sure some people are wondering why and how I came to a different conclusion from Schoenfeld’s meta-analysis comparing high load (loads >50% of 1rm) and low load (loads <50% of 1rm). The biggest reason is that we included different studies. He included Holm’s study and I didn’t (for the reasons given above), Jenkins’ study wasn’t published yet, and Schoenfeld’s own study comparing 8-12rm training to 25-35rm training wasn’t published yet when he did the meta-analysis. Including Jenkins’ and Schoenfeld’s studies and excluding Holm’s push the average outcomes toward “no difference.” Furthermore, you get a slightly different picture when you compare every calculable effect size (as in a meta-analysis) vs. attempting to not give any study undue weight. Both Schoenfeld’s meta-analysis and my article, found a trend toward moderate reps beating out high reps when looking at effect sizes. However, that’s largely influenced by Schuenke’s study. When I looked at percent changes and took a weighted average of fiber size to get an idea of how much the “average” muscle fiber grew, Schuenke’s study was only counted once. However, when calculating effect sizes, since growth is reported for each fiber type, Schuenke’s study is effective counted three times, allowing it to swing the analysis in moderate reps’ favor.
Thanks for being a diligent reader and checking out the supplemental material! If you haven’t finished the main article yet, feel free to venture back over there now.
Graphic says metabolic tension instead of mechanical tension
ahh dang it. Thanks for the catch!
Hey, great art. and quick question here – what are your thoughts on GVT?
It can work, but it’s overkill for most people.
In the Brad Schoenfeld and Mangine study, they used advanced subjects, but if that’s the case, how could they have made so much progress in 8 weeks? I follwed the exact same training protocol in the Brad Schoenfeld study for 4 months, and I plateau at around week 8 and I only made just slightly noticeable gains. These lifters are making great gains off of Brad Schoenfeld’s study training protocol, and I am not. Is there something I am doing wrong?
1) Even if the average subject made pretty big gains, there are always subjects in those studies that don’t gain much either.
2) “Trained” subjects =/= ‘advanced’ athletes generally. Typically, you’ll see benches around 90-100kg pre-training, and squats 120-160kg pre-training. Numbers most people definitely have to work for, but numbers that moreso correspond with the internet’s definitions of later novice or early intermediate trainees. This tells you they’ve put in the requires 2-3 years in the gym, but probably haven’t really been training all that hard.
“Title: Neuromuscular adaptations after 2- and 4-weeks of 80% versus 30% 1RM resistance training to failure
Author: Jenkins
Muscle(s) examined: Biceps
Sets/Reps compared: 3 sets to failure with either 80% or 30%
Increase in muscle size: 6.6% for 30%, and 8.59% for 80%
Significant difference? No”
– there is no difference??? It depends on the viewpoint!
8.59% to 6.6% = 23.1% difference!
so it is a noticeable difference!
I just took this random example.
but is valid for all studies listed on this page.
all have a significant difference, yes!
tks!
It wasn’t a statistically significant difference, and the effect size for the interaction effect in the ANOVA model was also trivial (partial eta squared = 0.03-0.06 for each of the three sites measured). And when we’re dealing with muscles that are only about 3cm thick, the 2% group difference for the increase amounts to just 0.6mm.
you’re right!
really the difference is insignificant.
but…
8.59% to 6.6% = 23.1%
or 23% more earnings!
in terms of gains, hypertrophy and results, 23% is very considerable.
logically that is little in the short term, but imagine the result of 23% in earnings over years and years …
is the gain that every individual of 220lb, “needs” to reach 271lb body weight. (23%)
It’s a gross example I gave, it’s something relevant. Even more if it is a matter of hypocrisy, any 1% makes the difference in the long run.
If a fairly large relative difference isn’t statistically significant, that means the results were noisy and highly variable, so assuming a difference close to the mean difference for any individual is very tenuous.
But wait, something’s not checking out in that “line of best fit” part. In the original article while Krieger does say 4-6, he only lists 4 sets in the table. Moreover, he explicitly states that previous meta-analyses showed a plateau at 4-6. The curve could be much steeper on the left and nearly asymptotic at 5 or 6.
Sure it could. This was just the curve that perfectly fit the reported effect sizes, and it winds up with the sort of curve one would kind of expect to see in the first place (decreased gains with high enough volume)